Project archive
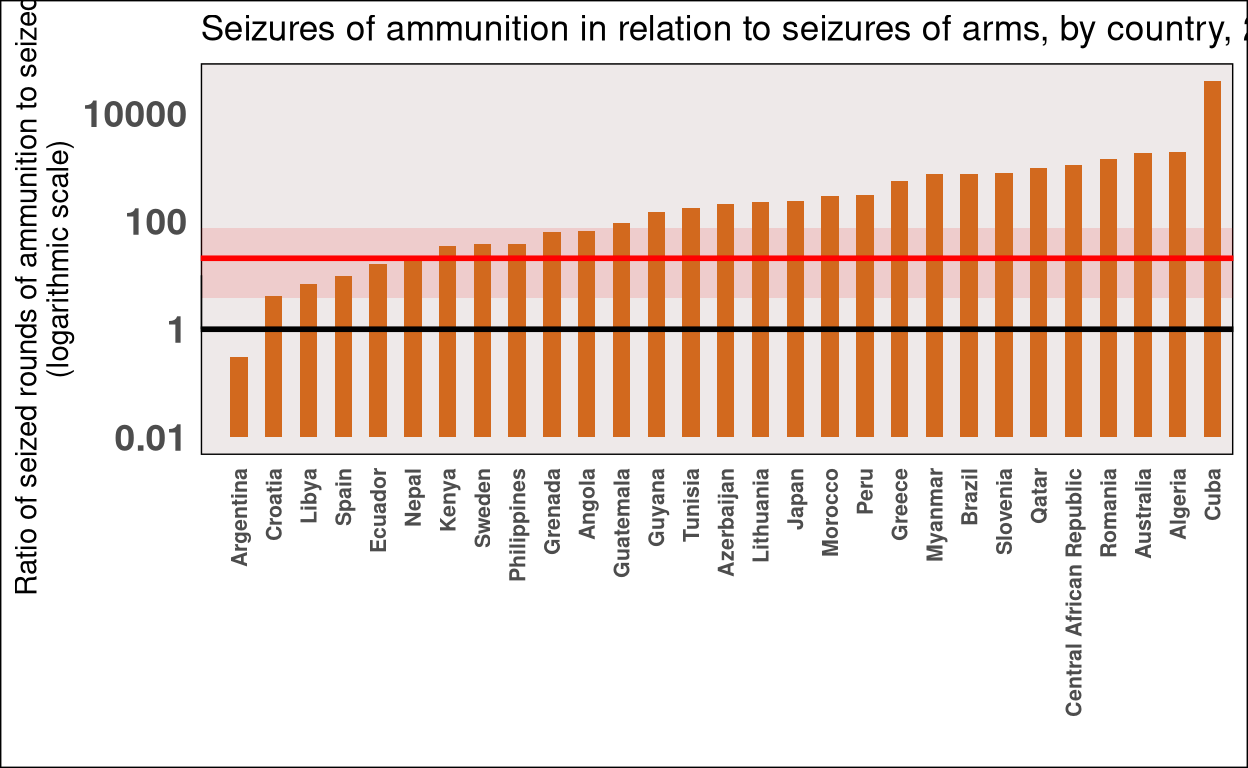
Seizures of Ammunition and Arms by Country 2017
A brief report based on UNs 2020 Global Study on Firearms Trafficking.
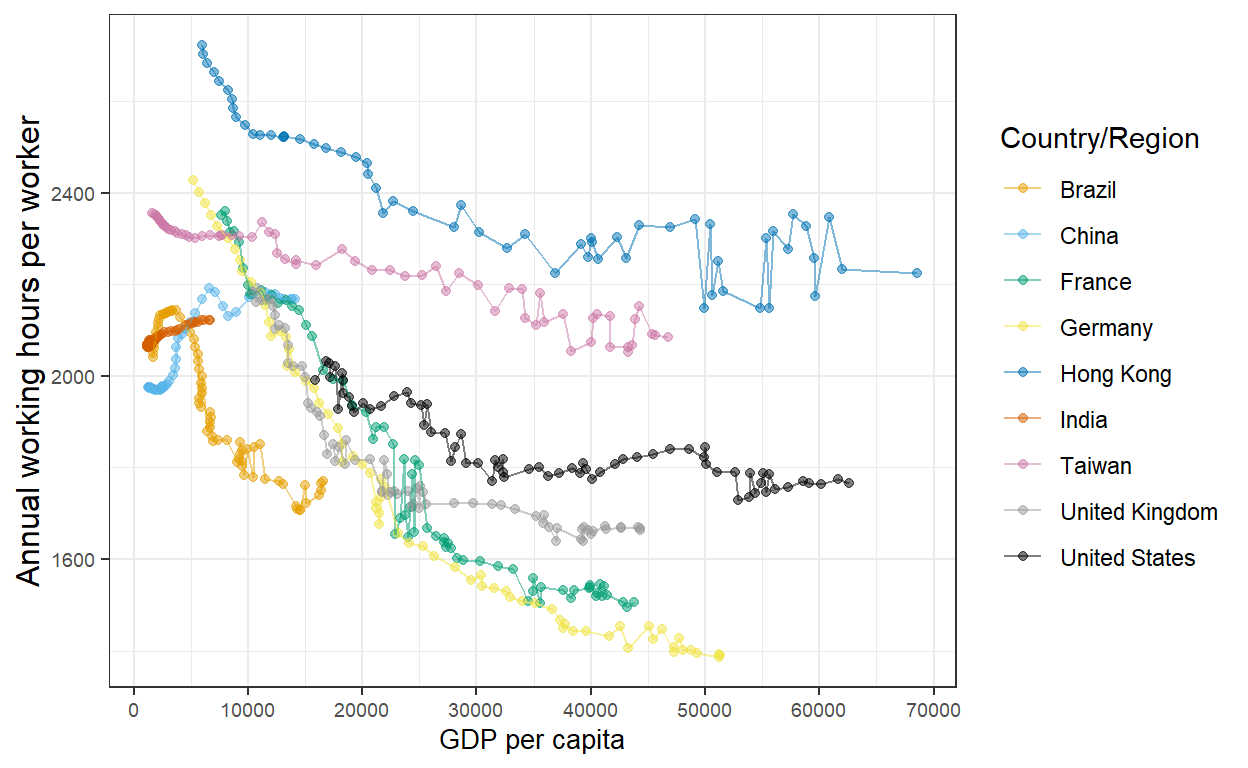
The Evolution of Working Hours in the World
This project consists in the replicaion and alternative representation of graphs from Our World in Data called "Working Hours".
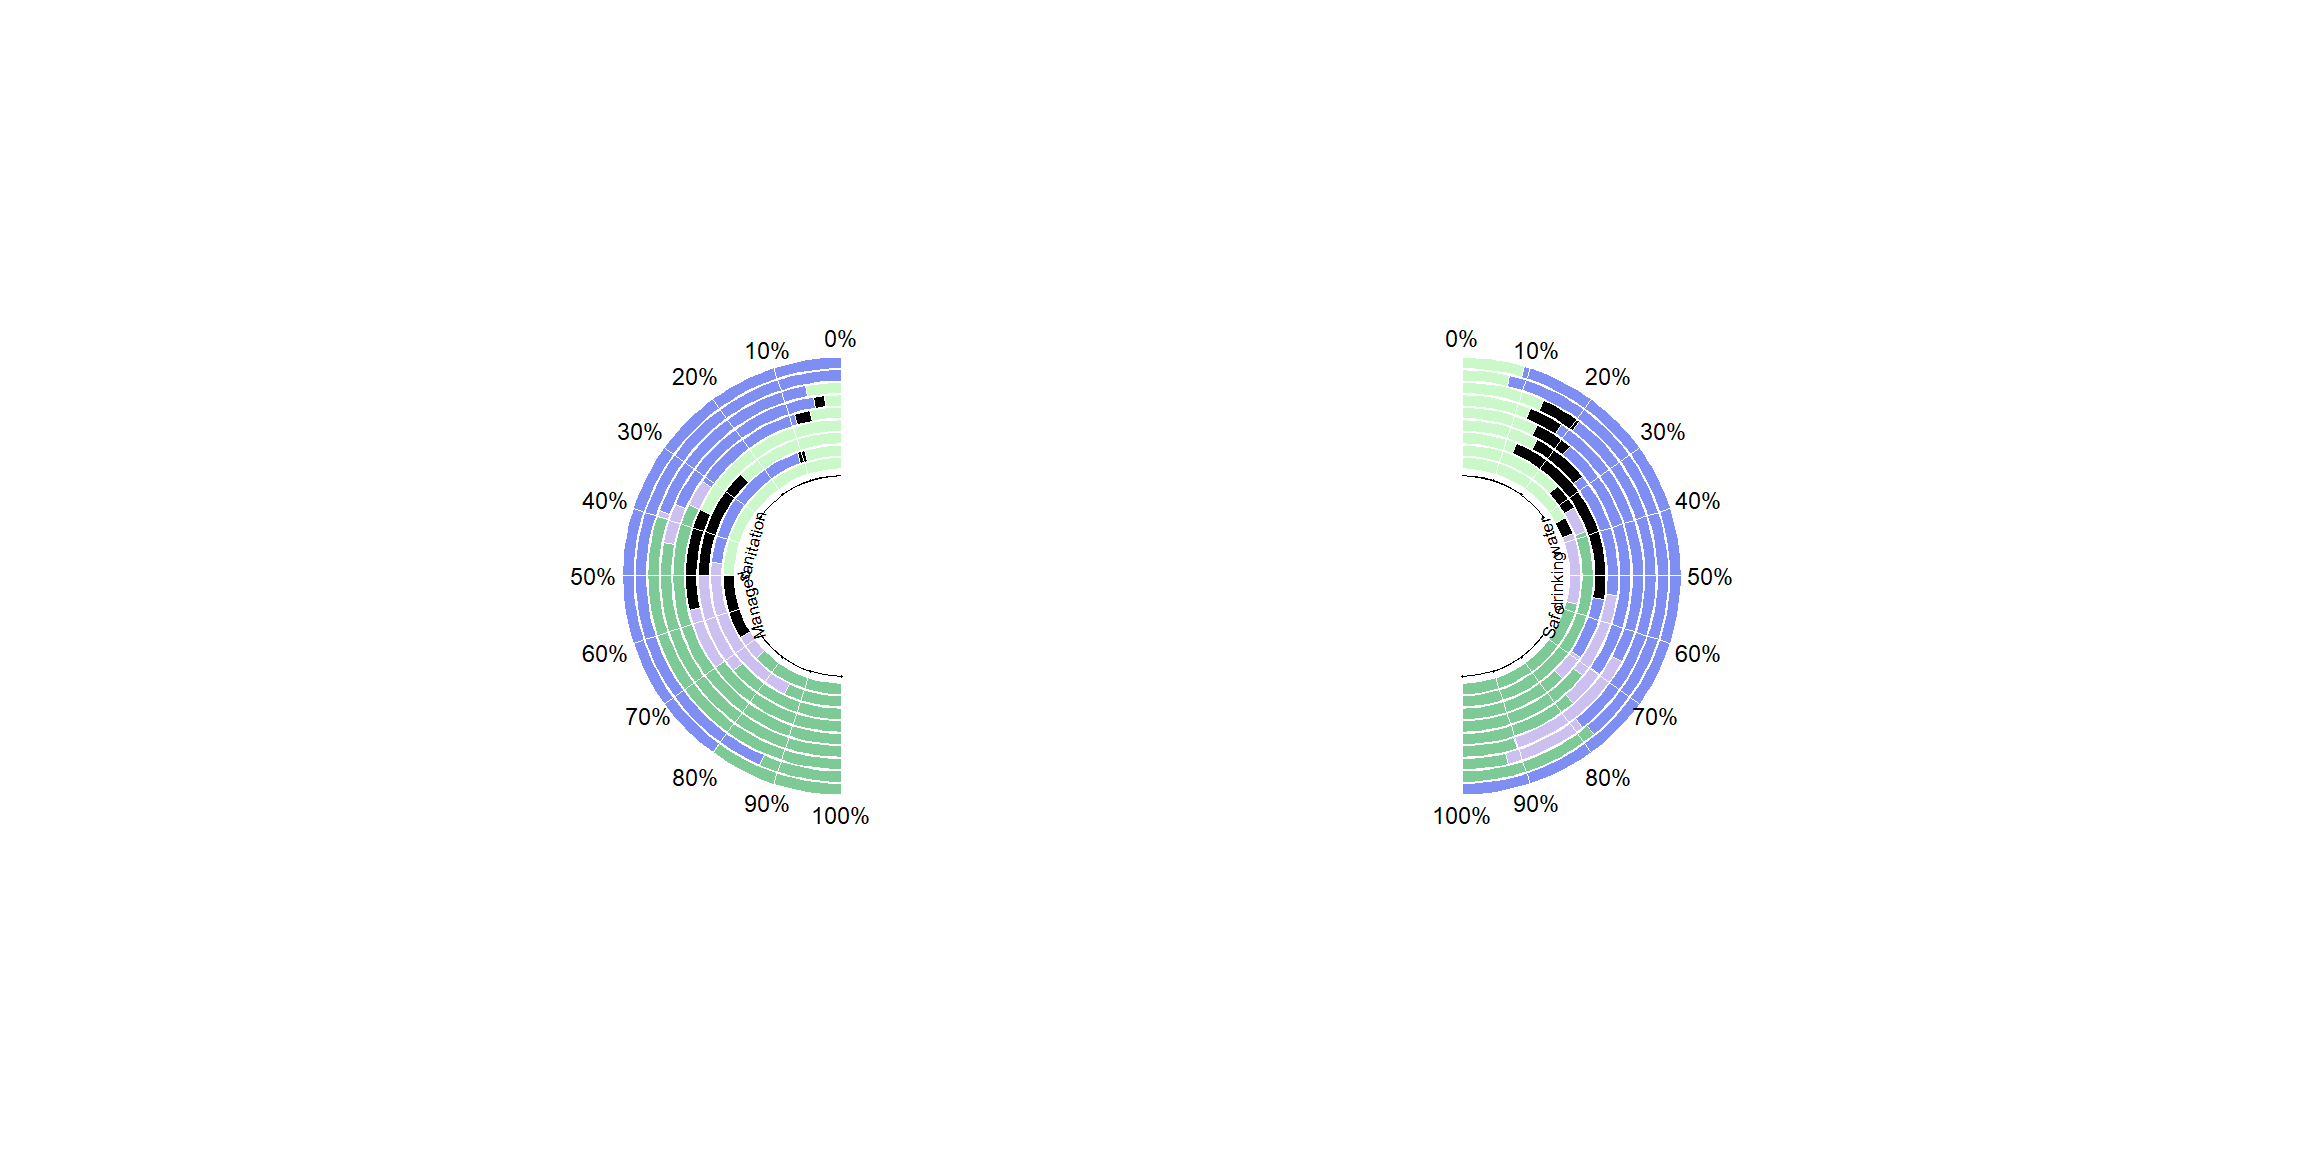
Water Sanitation Visualization
Graph on the use of water and water sanitisation tools among the various regions of the world.
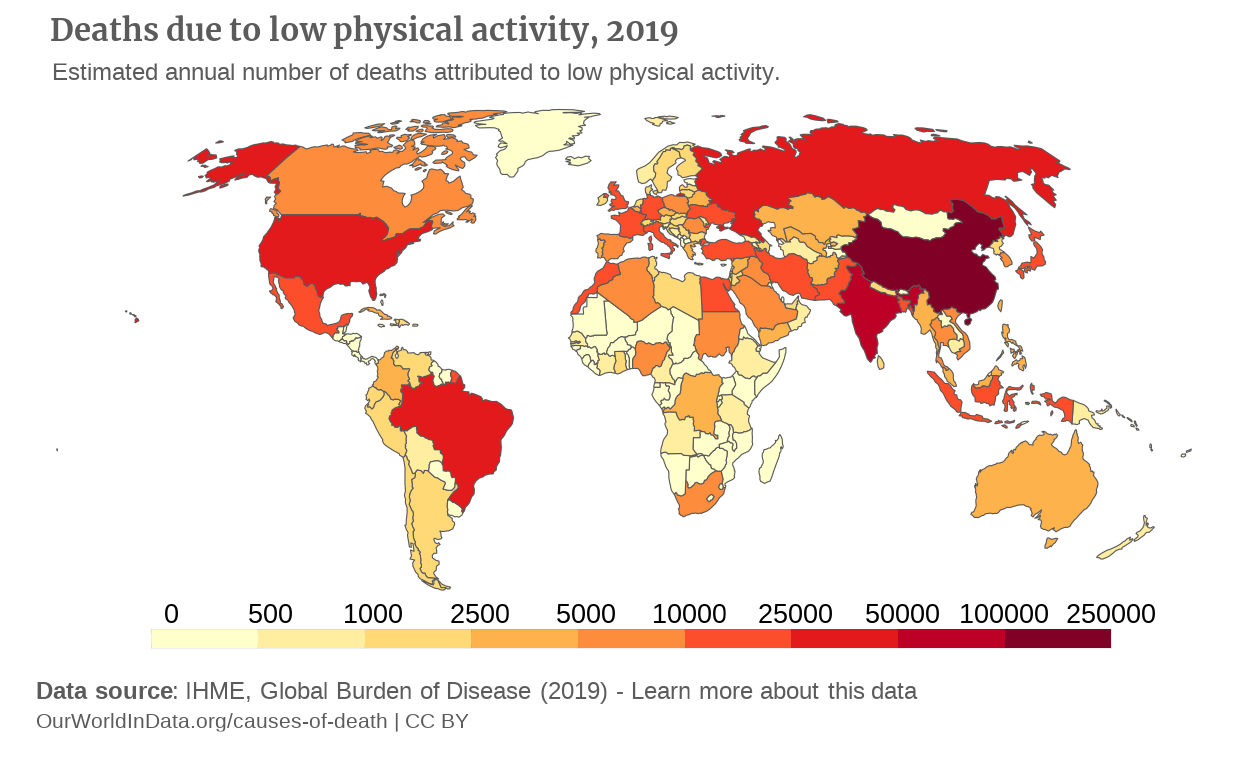
Is the World Moving Enough?
A look at the mortality due to low physical activity worldwide.
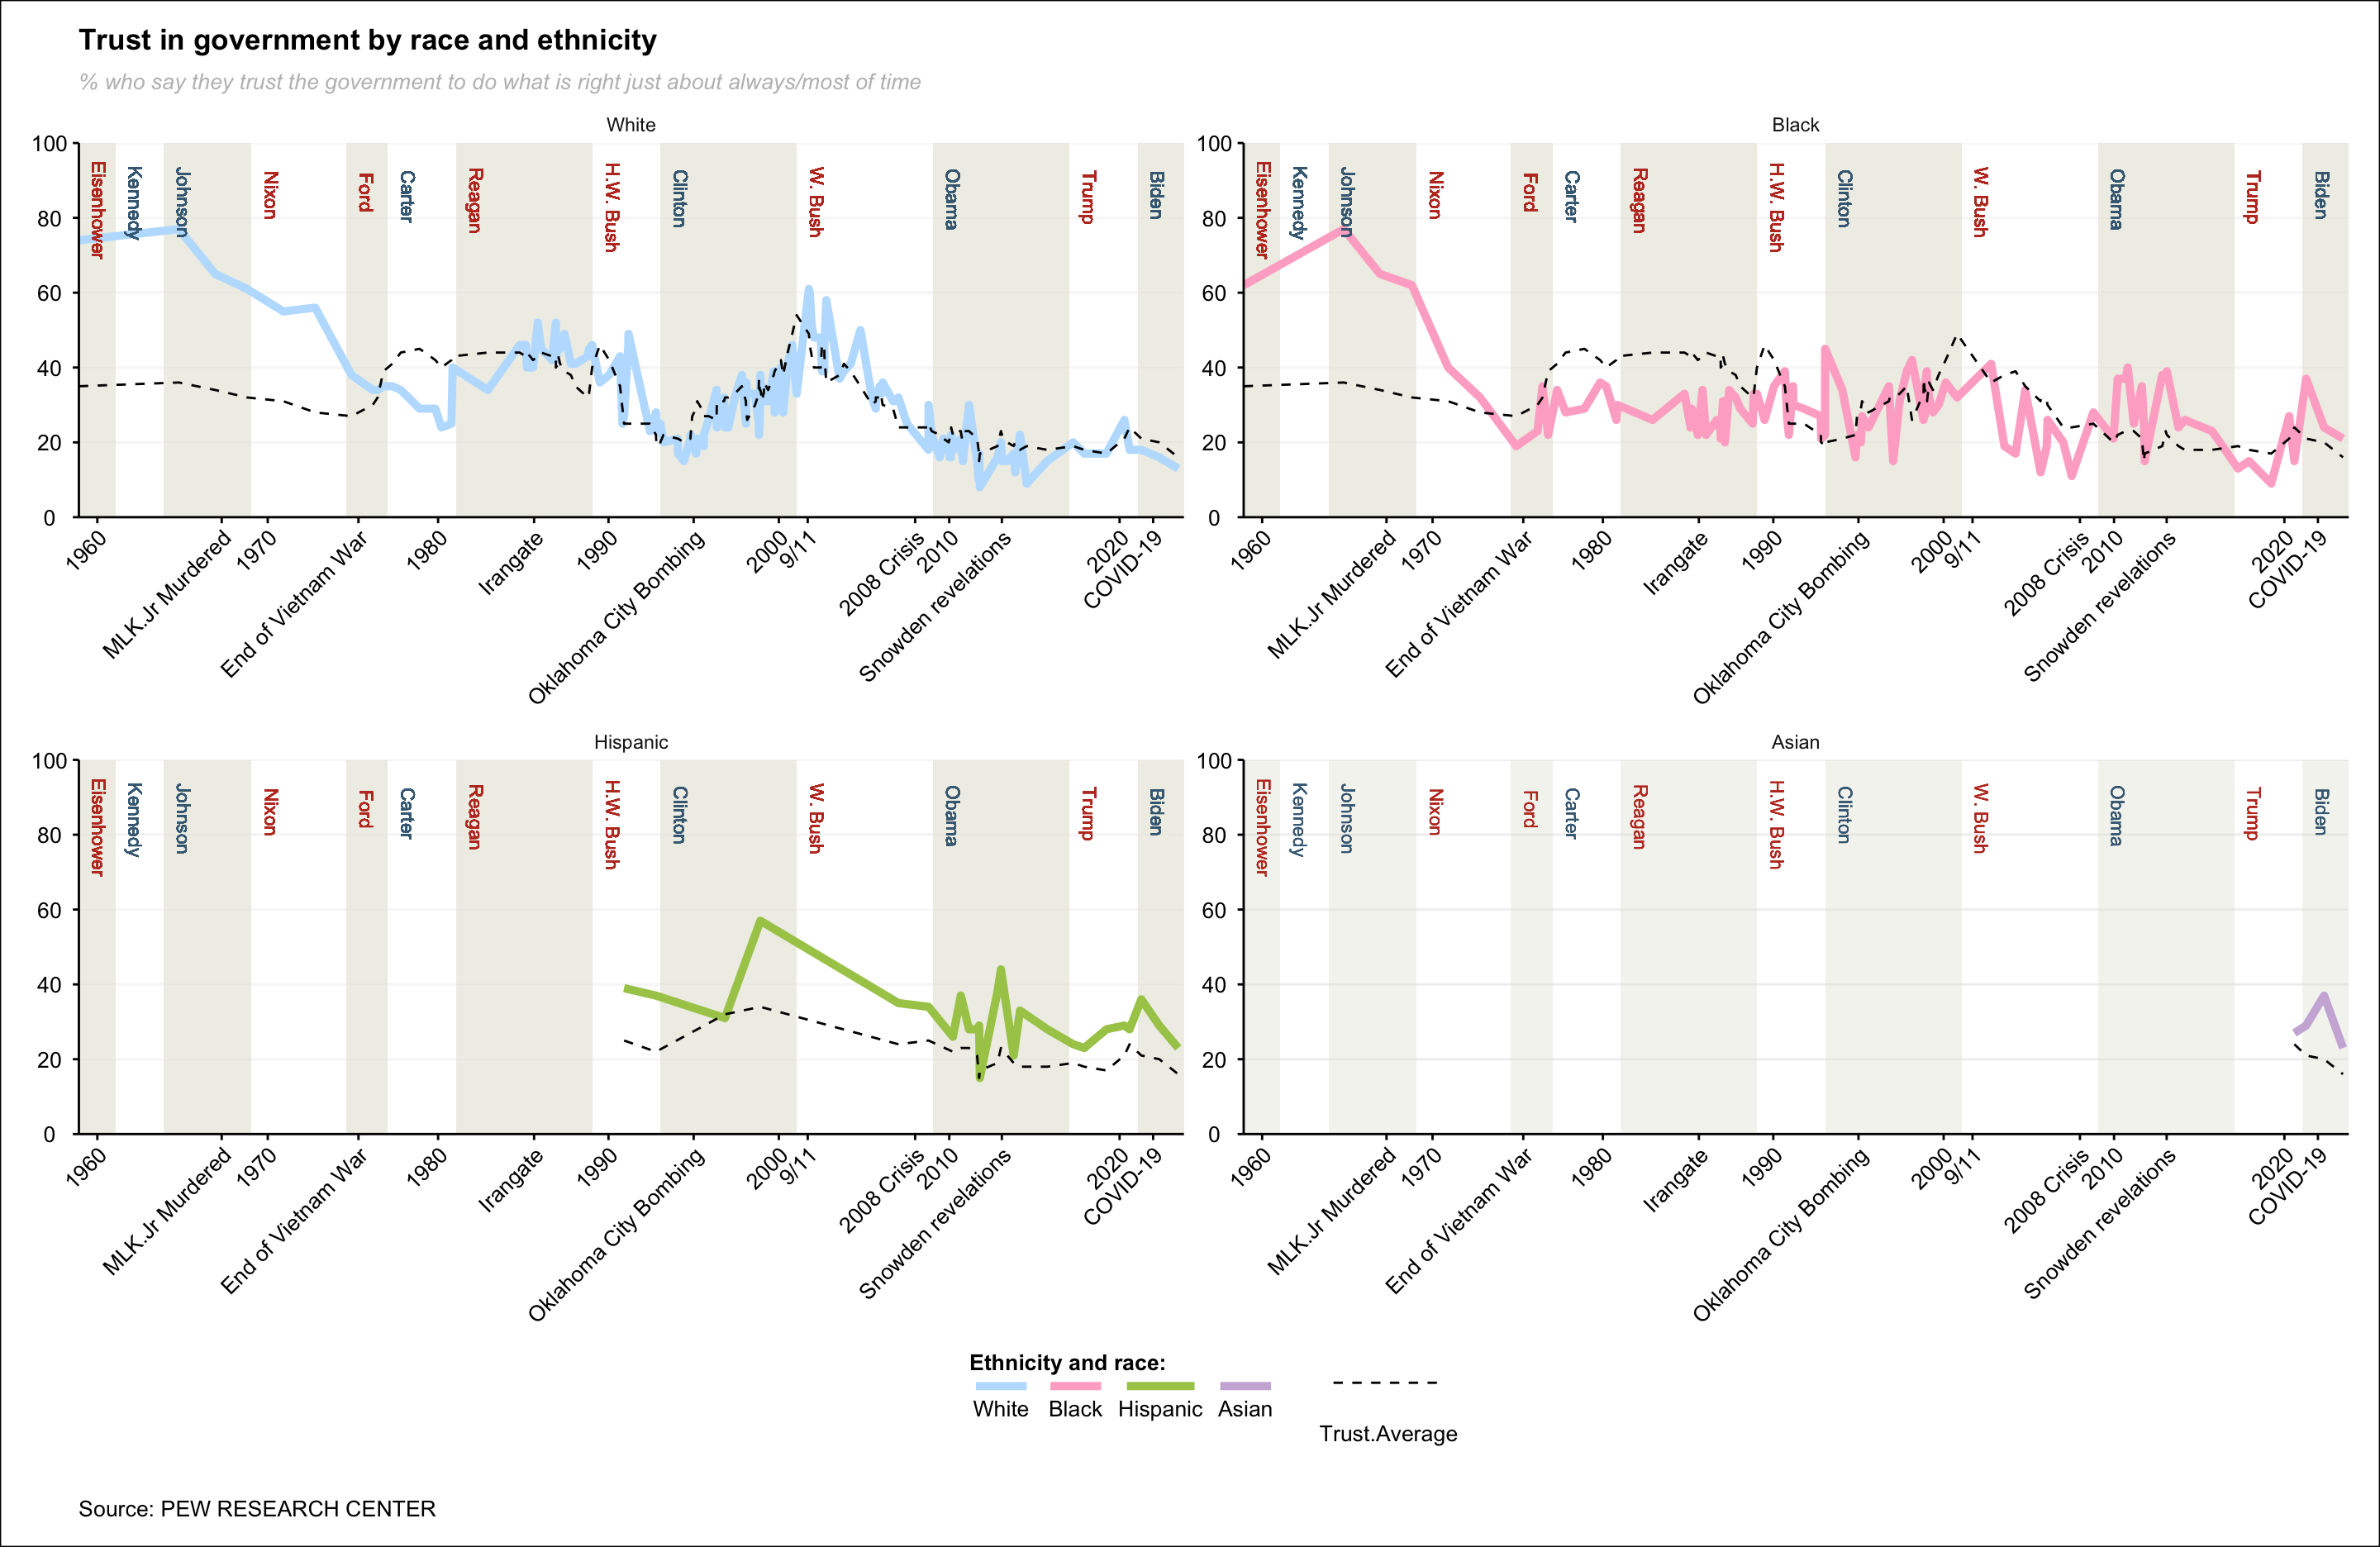
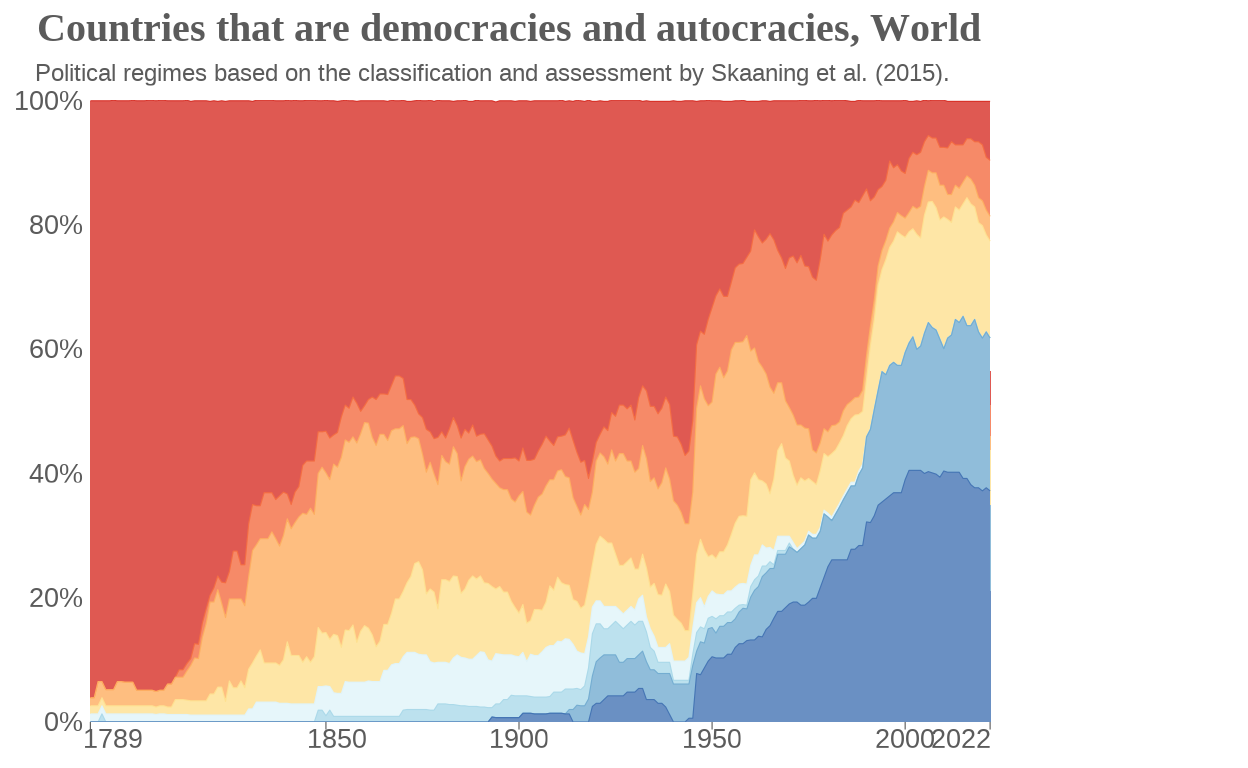
Public Trust in Government
Visual representation of the evolution of public trust in the United States government by race and ethnicity from 1958 to 2023, as documented in the Pew Research Paper.
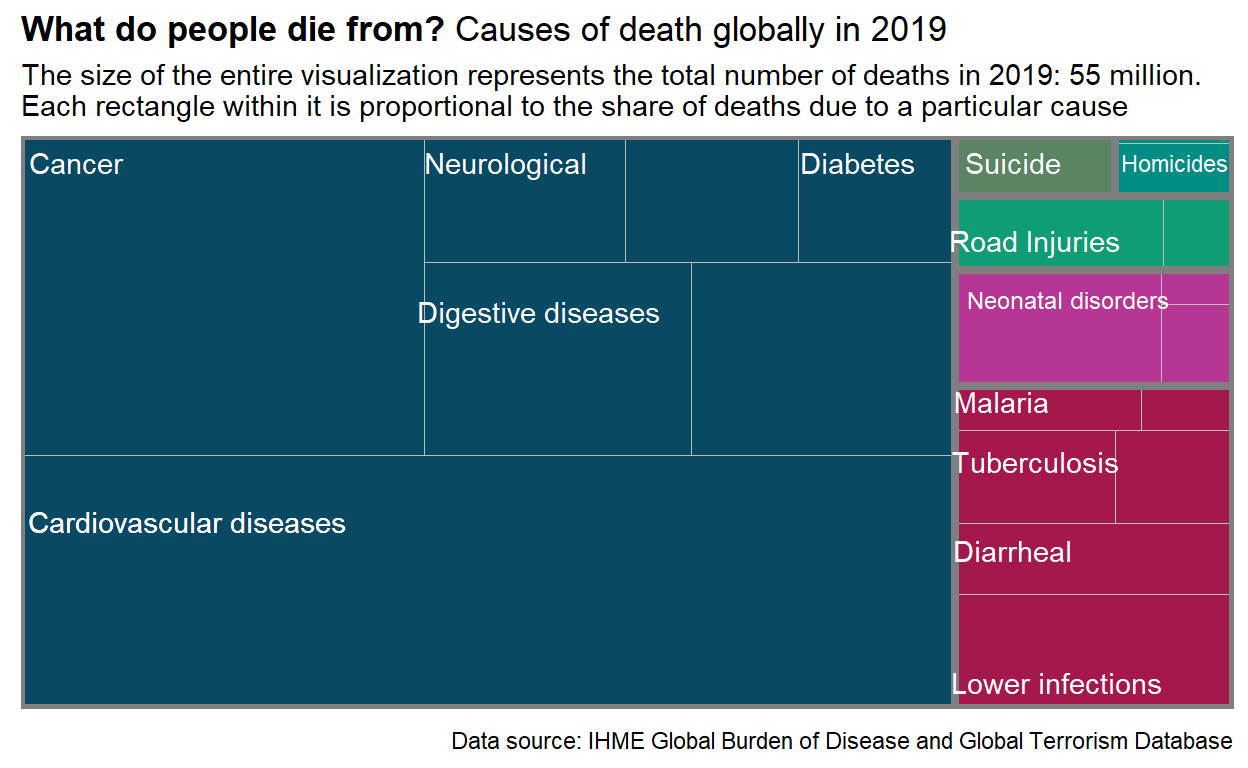
Causes of Deaths 2019
Treemap that describe the causes of death before covid pandemic.
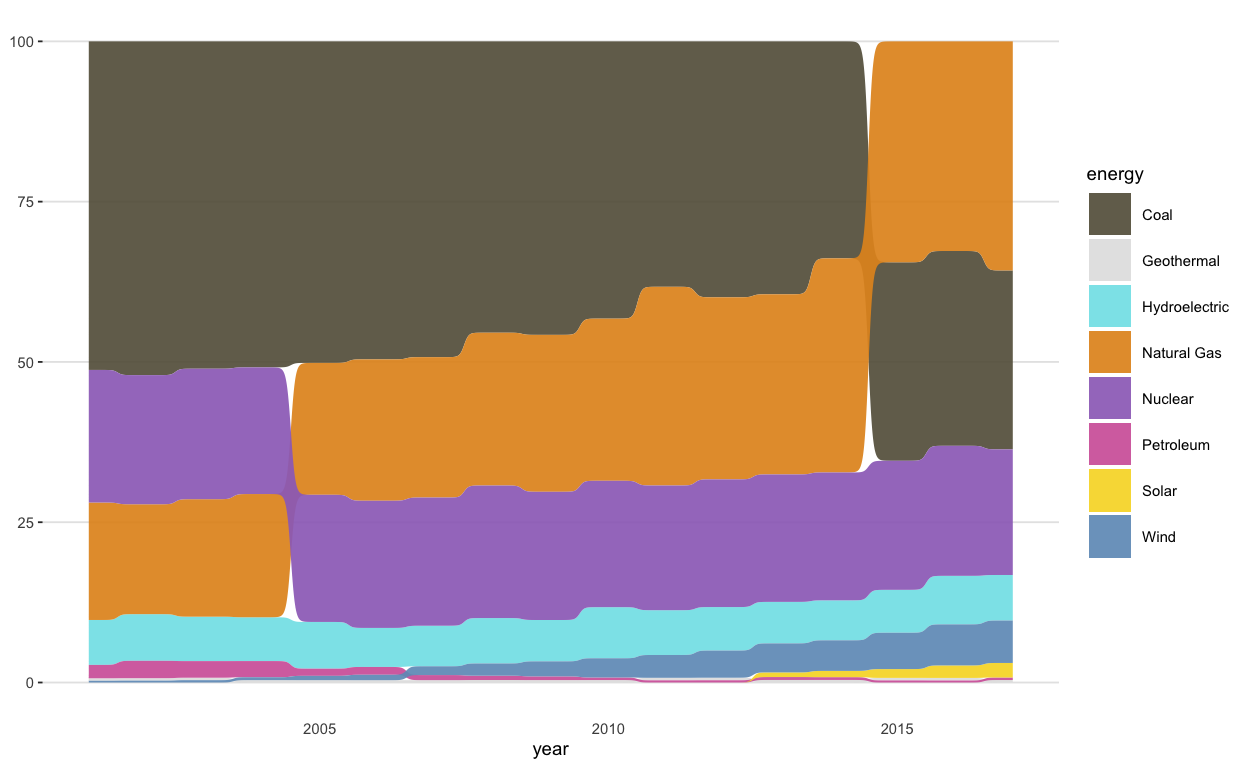
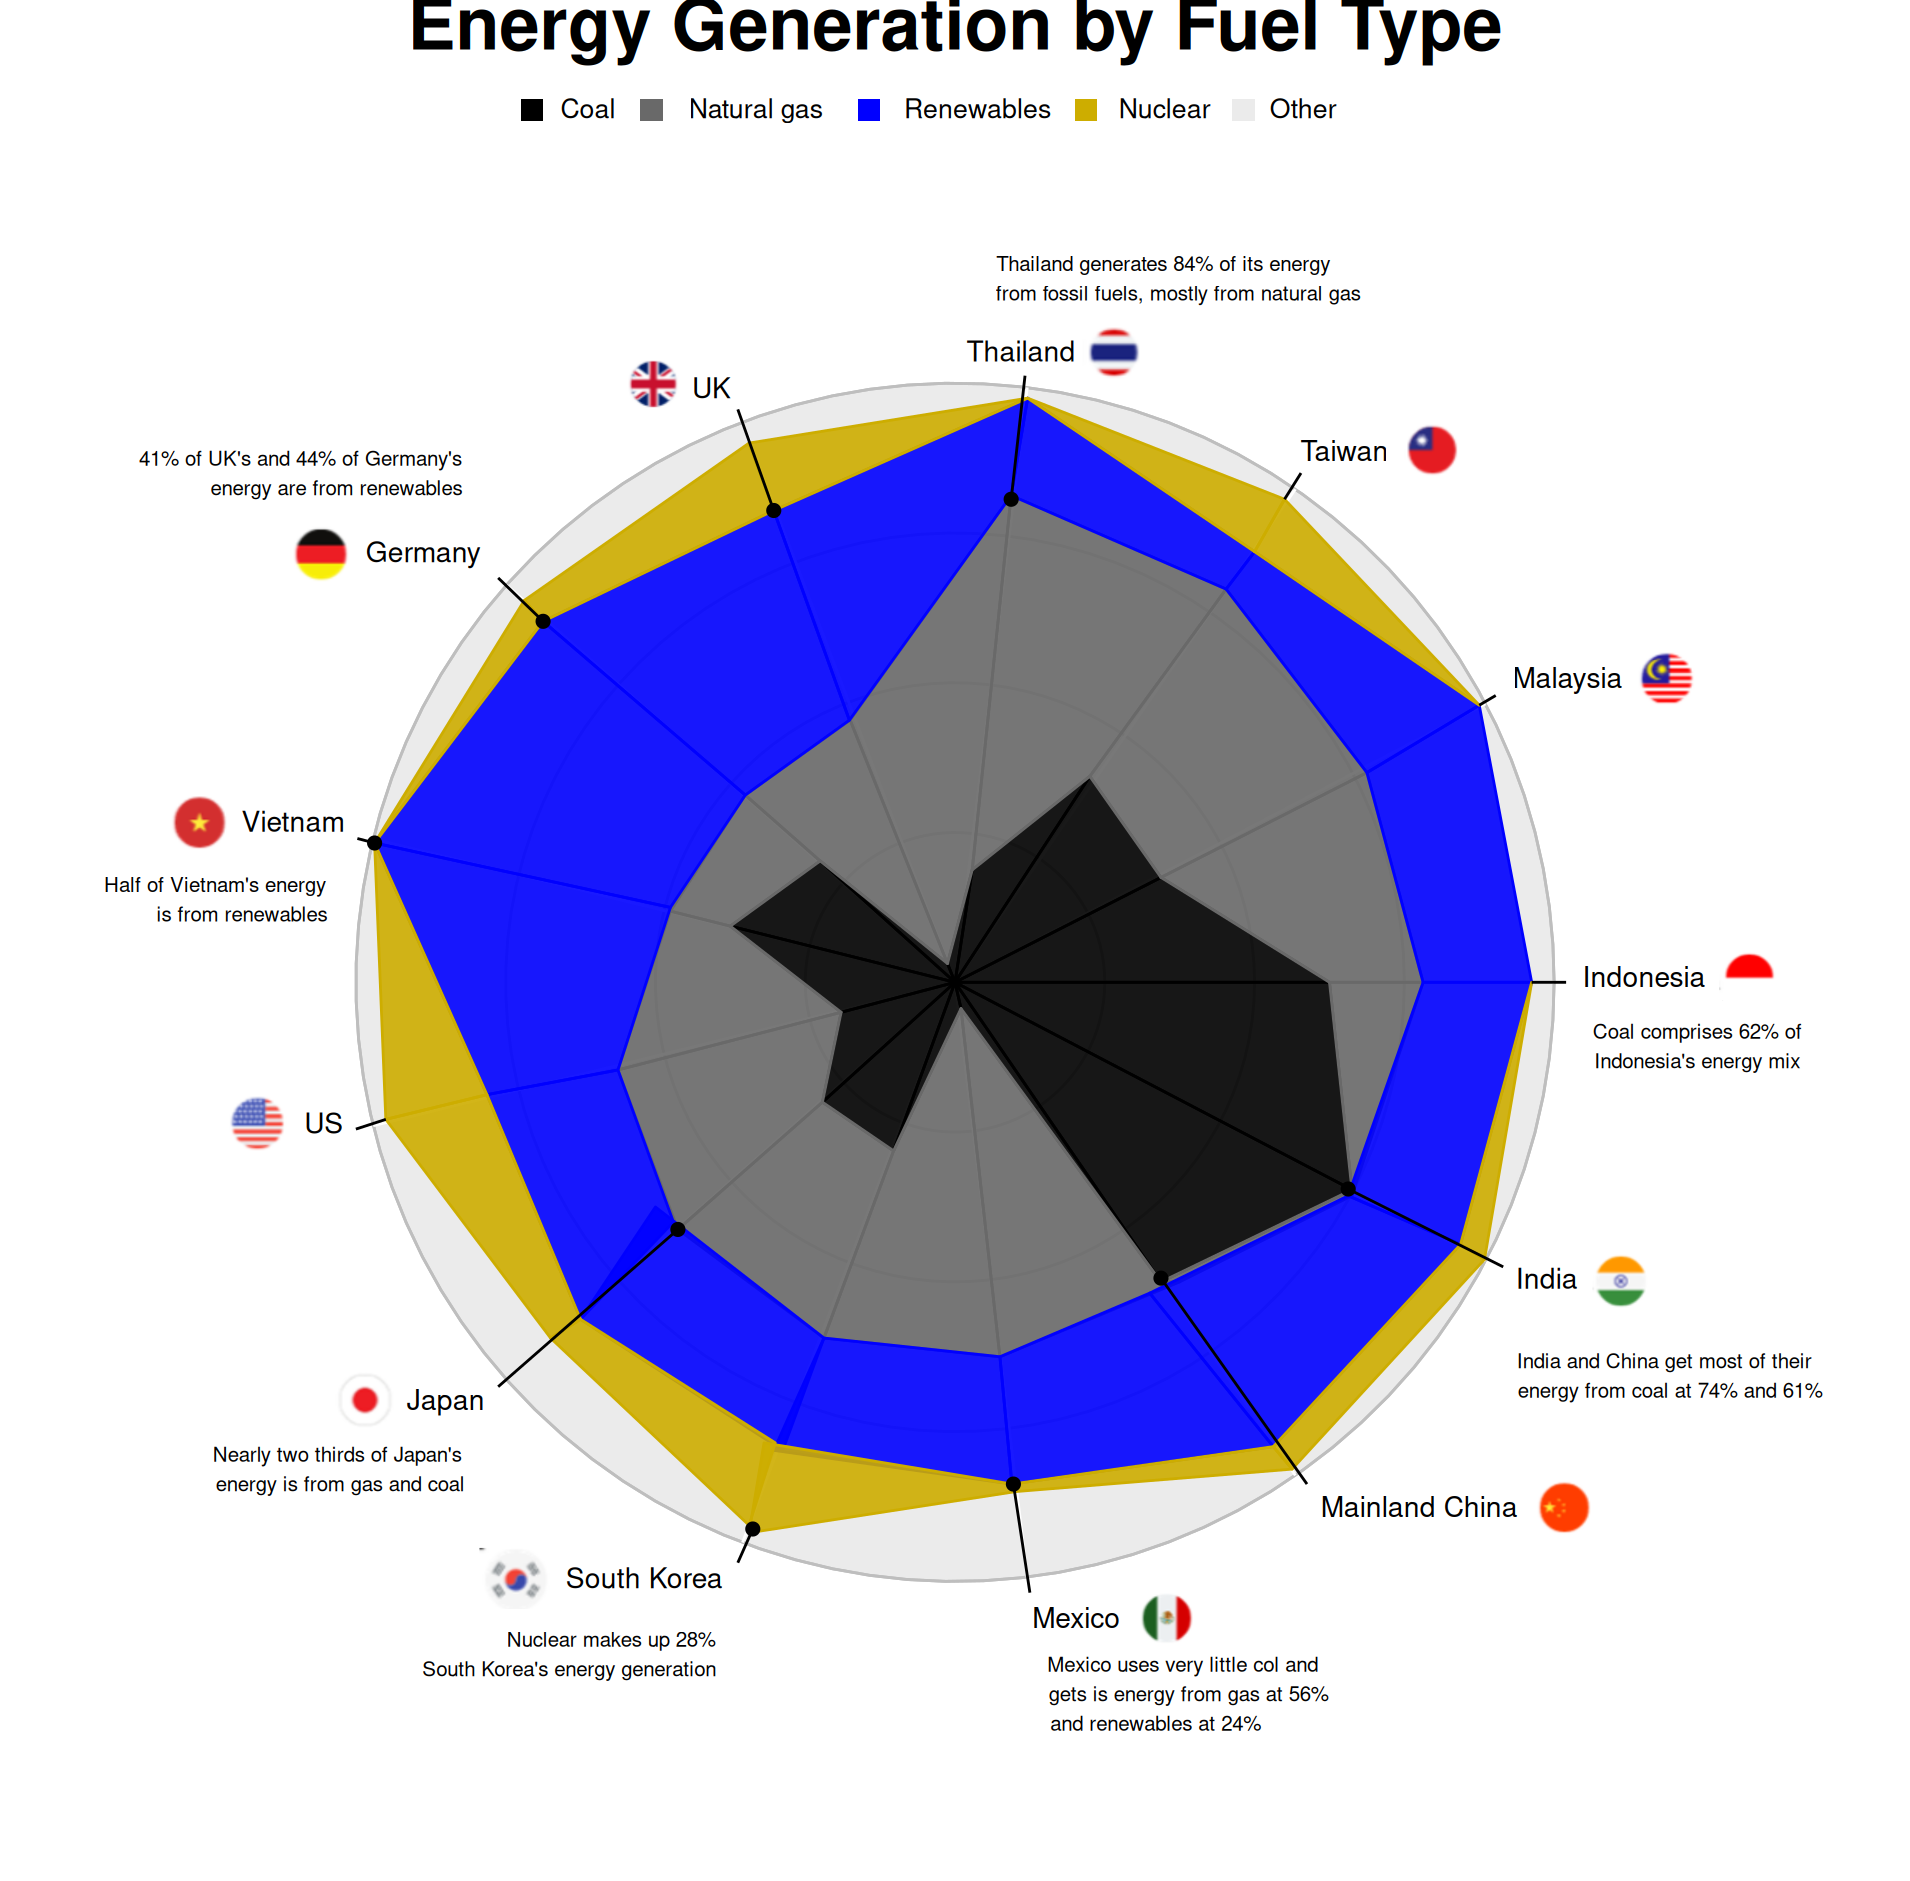
Changing Sources of Electricity Generation in the United States
This graph describes how the sources of electricity generation in the United States have changed from 2001 to 2017.
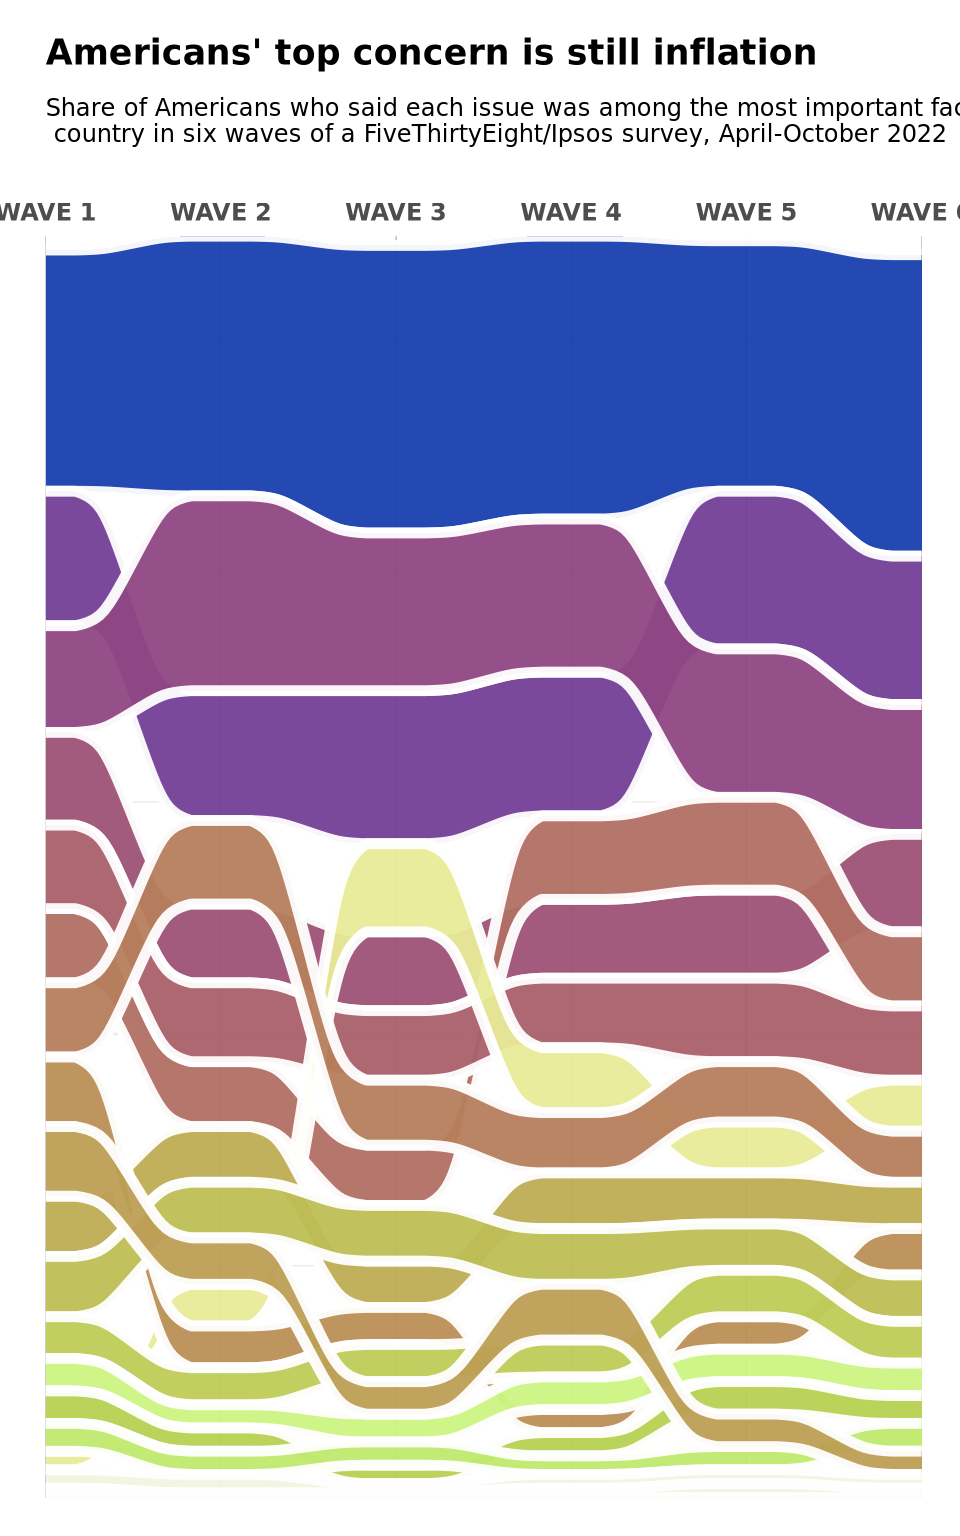
American's Top Concerns 2022
Most important issues for Americans, April-October 2022: step-by-step replication graph and a possible alternative.
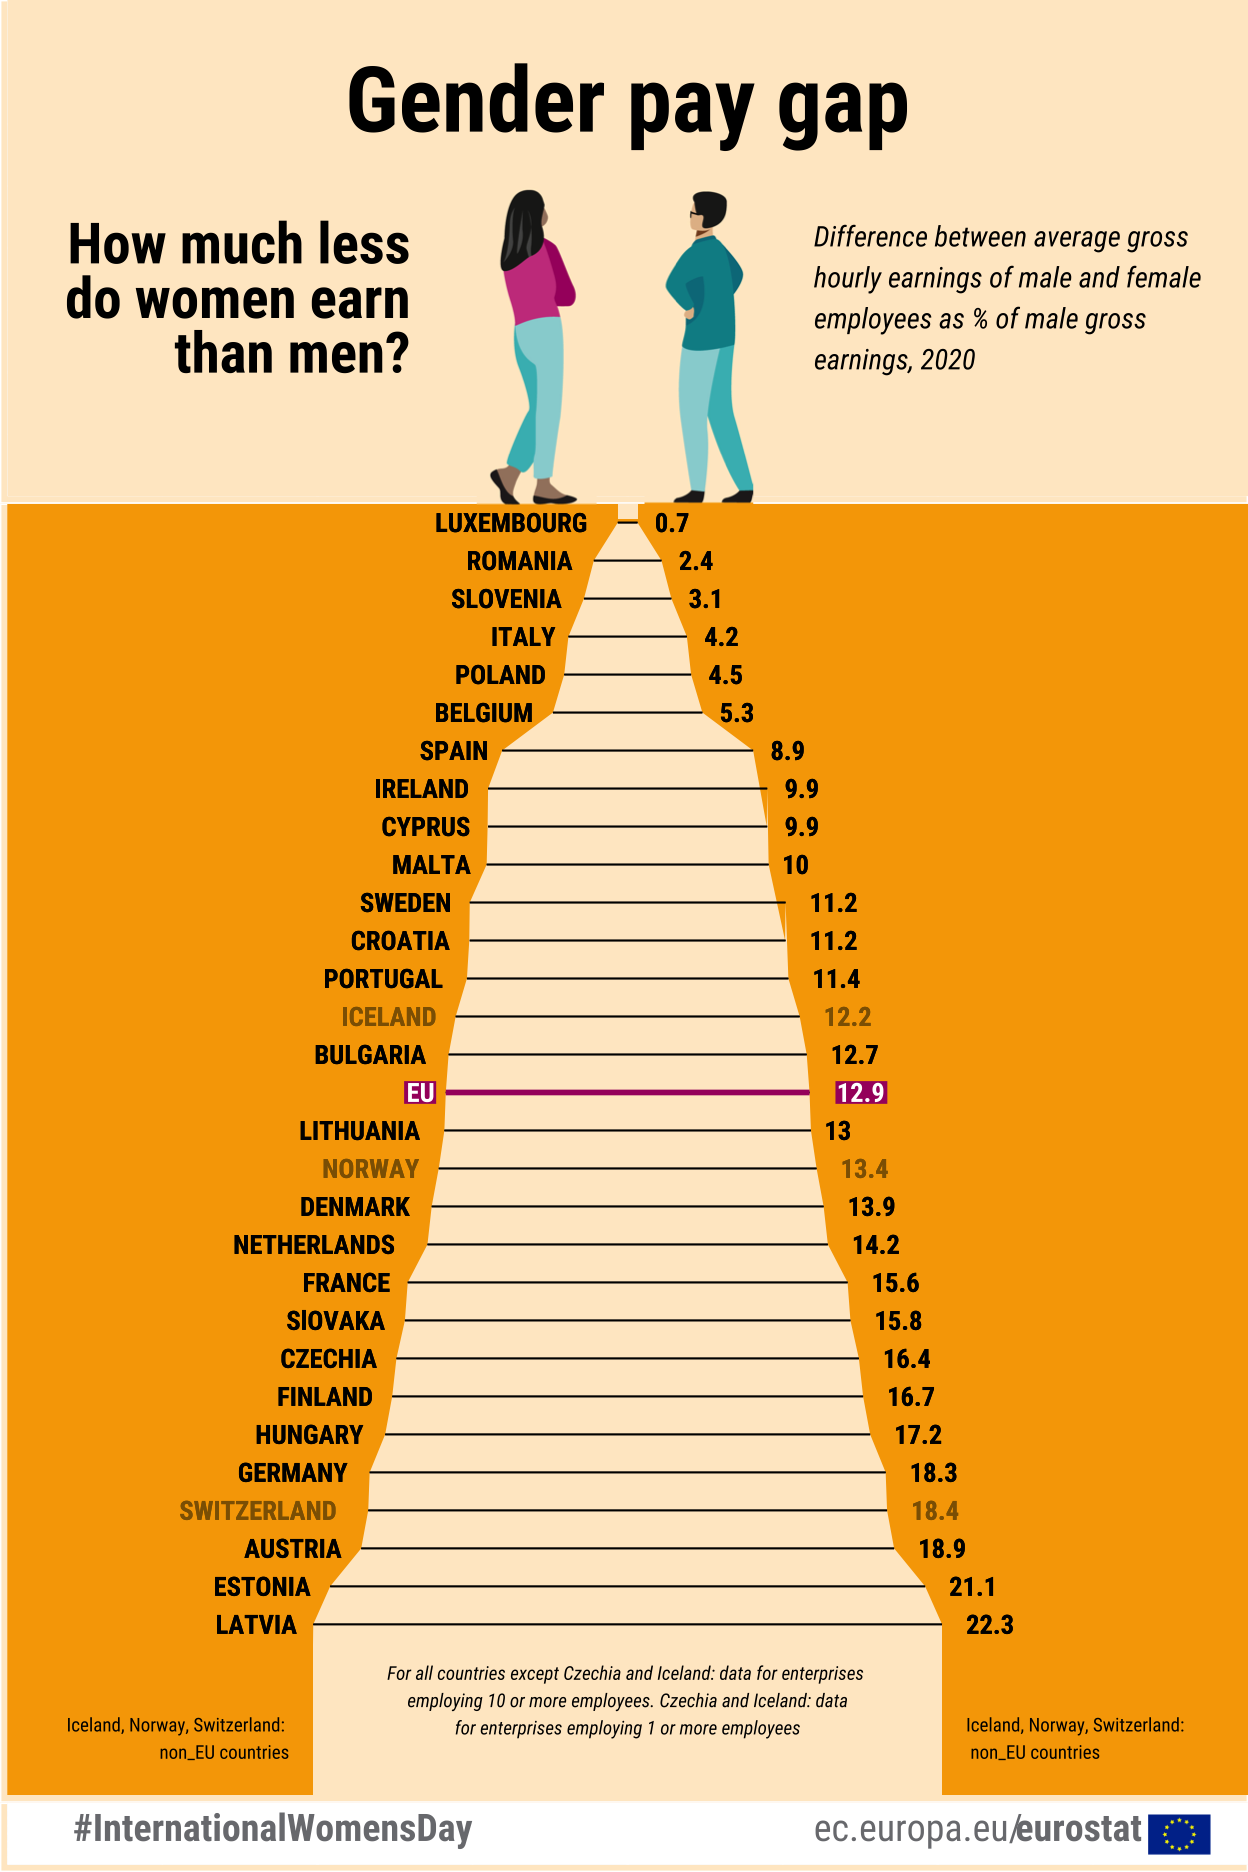
Gender Pay Gap Graph Replication
Using Eurstat data to reproduce the Gender Pay Gap graph of 2020.
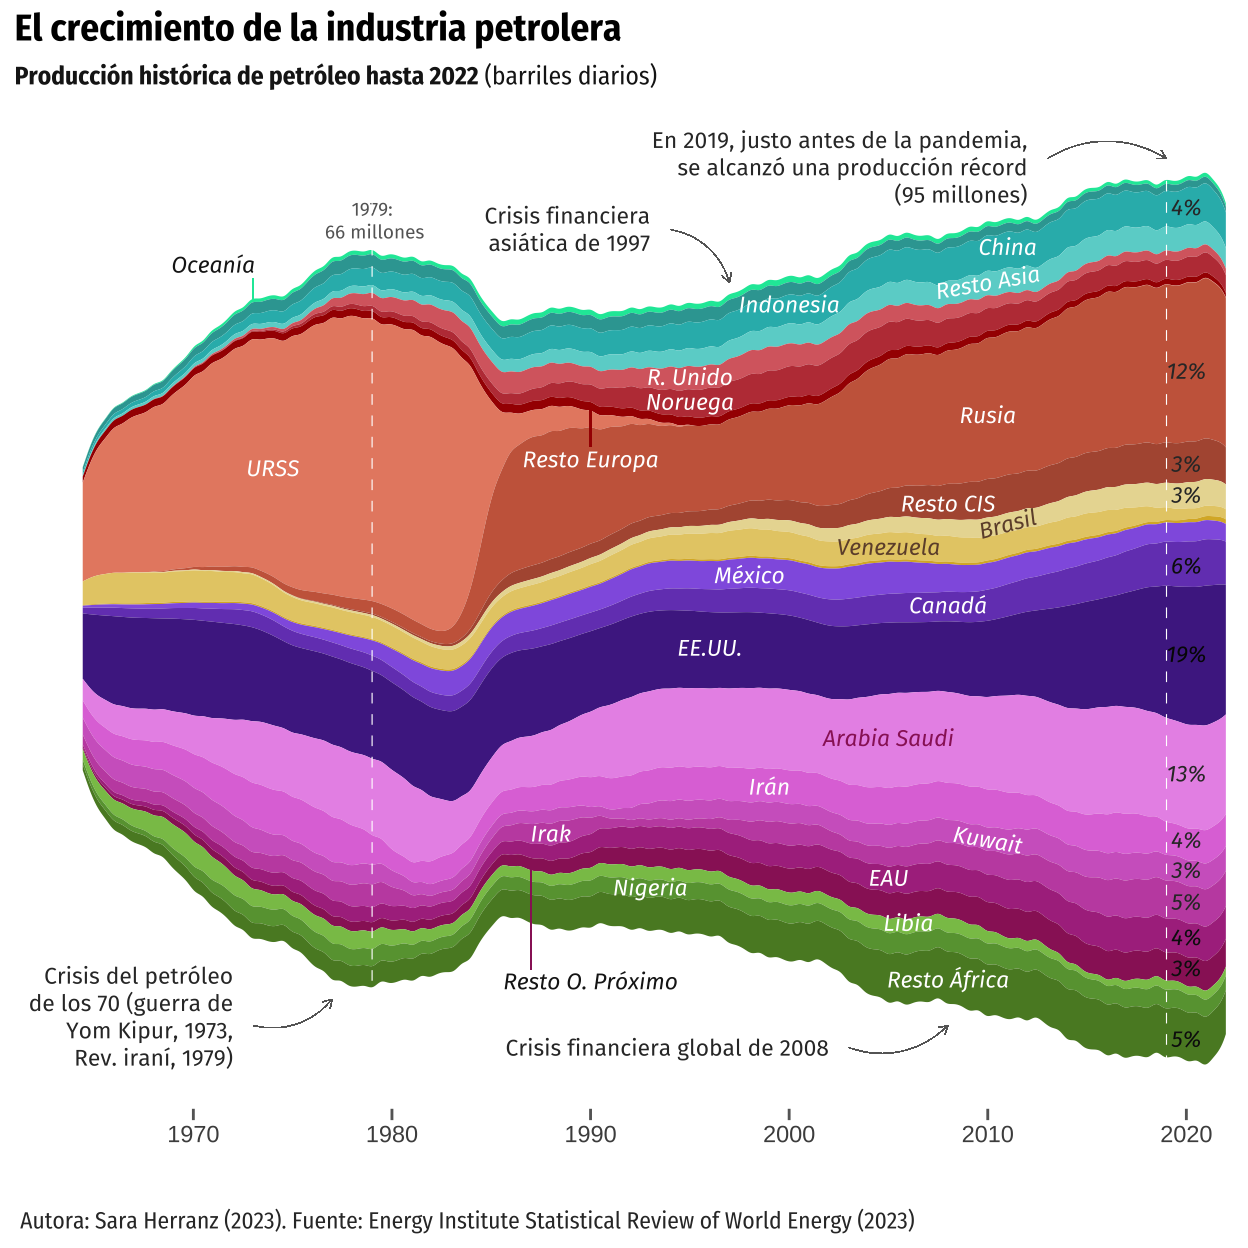
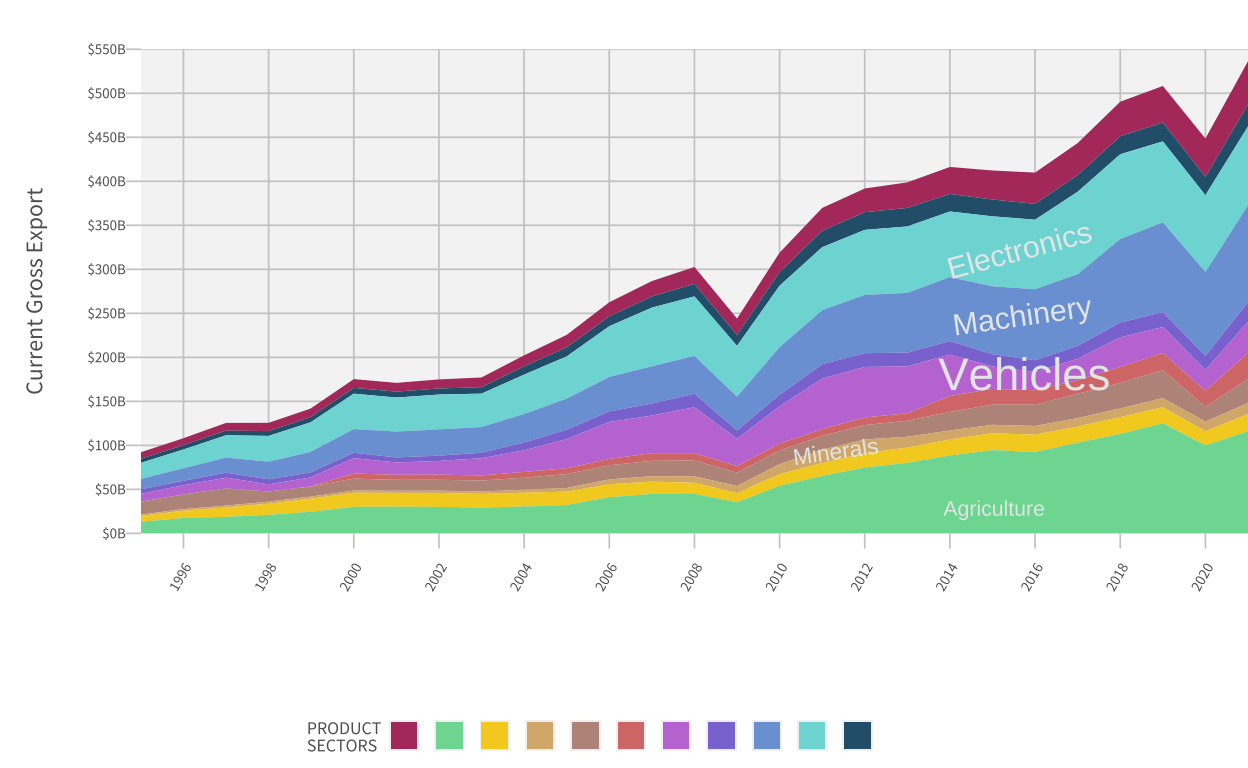
The Growth of the Oil Industry
Replication of a graph from El Orden Mundial which aims to represent the evolution of oil production since 1910.
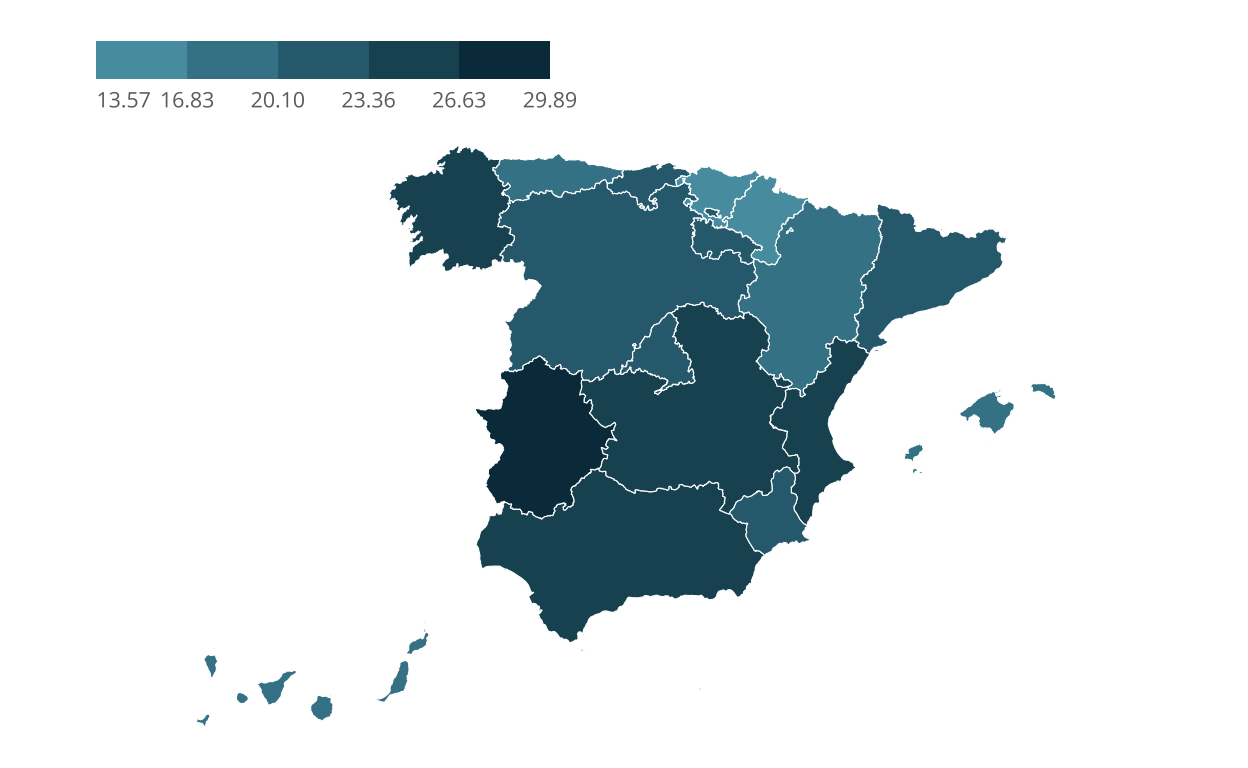
Unveiling Birth Clinical Practice in Spain: Mapping the Cesarian Sections and Birth Dynamics
Exploring the nuances of maternal healthcare in Spain through an augmented map, showcasing original cesarean section rates alongside additional insights such as total births per autonomous community and cesarean rates adjusted for the average maternal age.
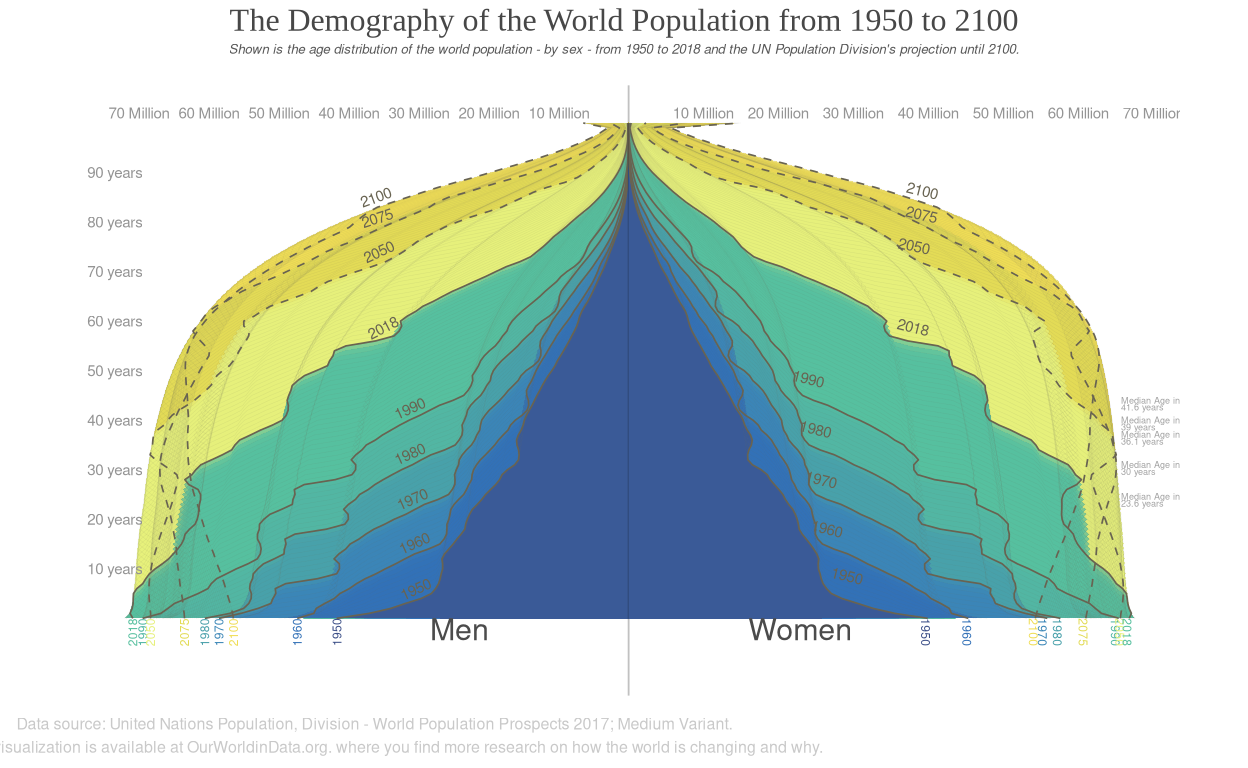
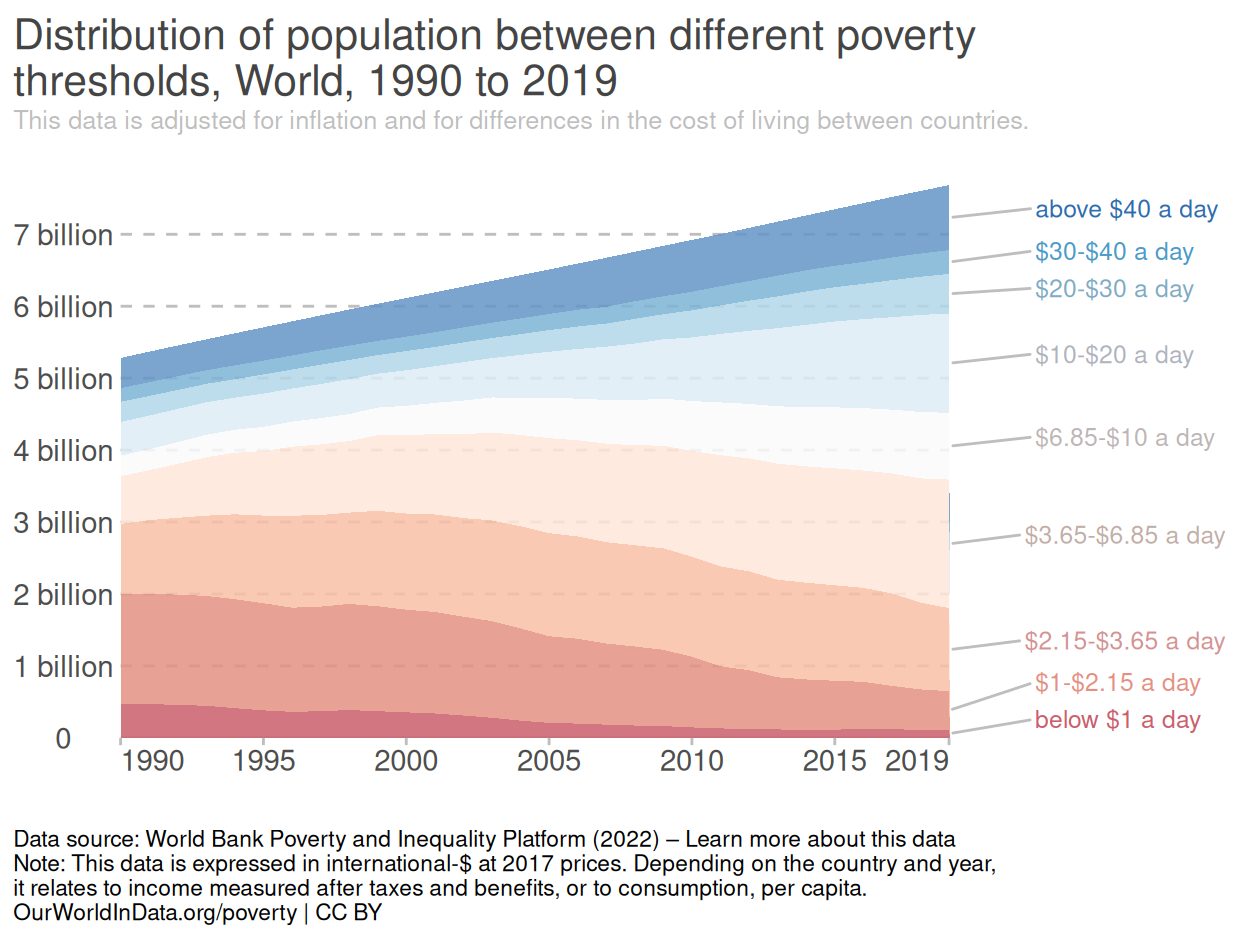
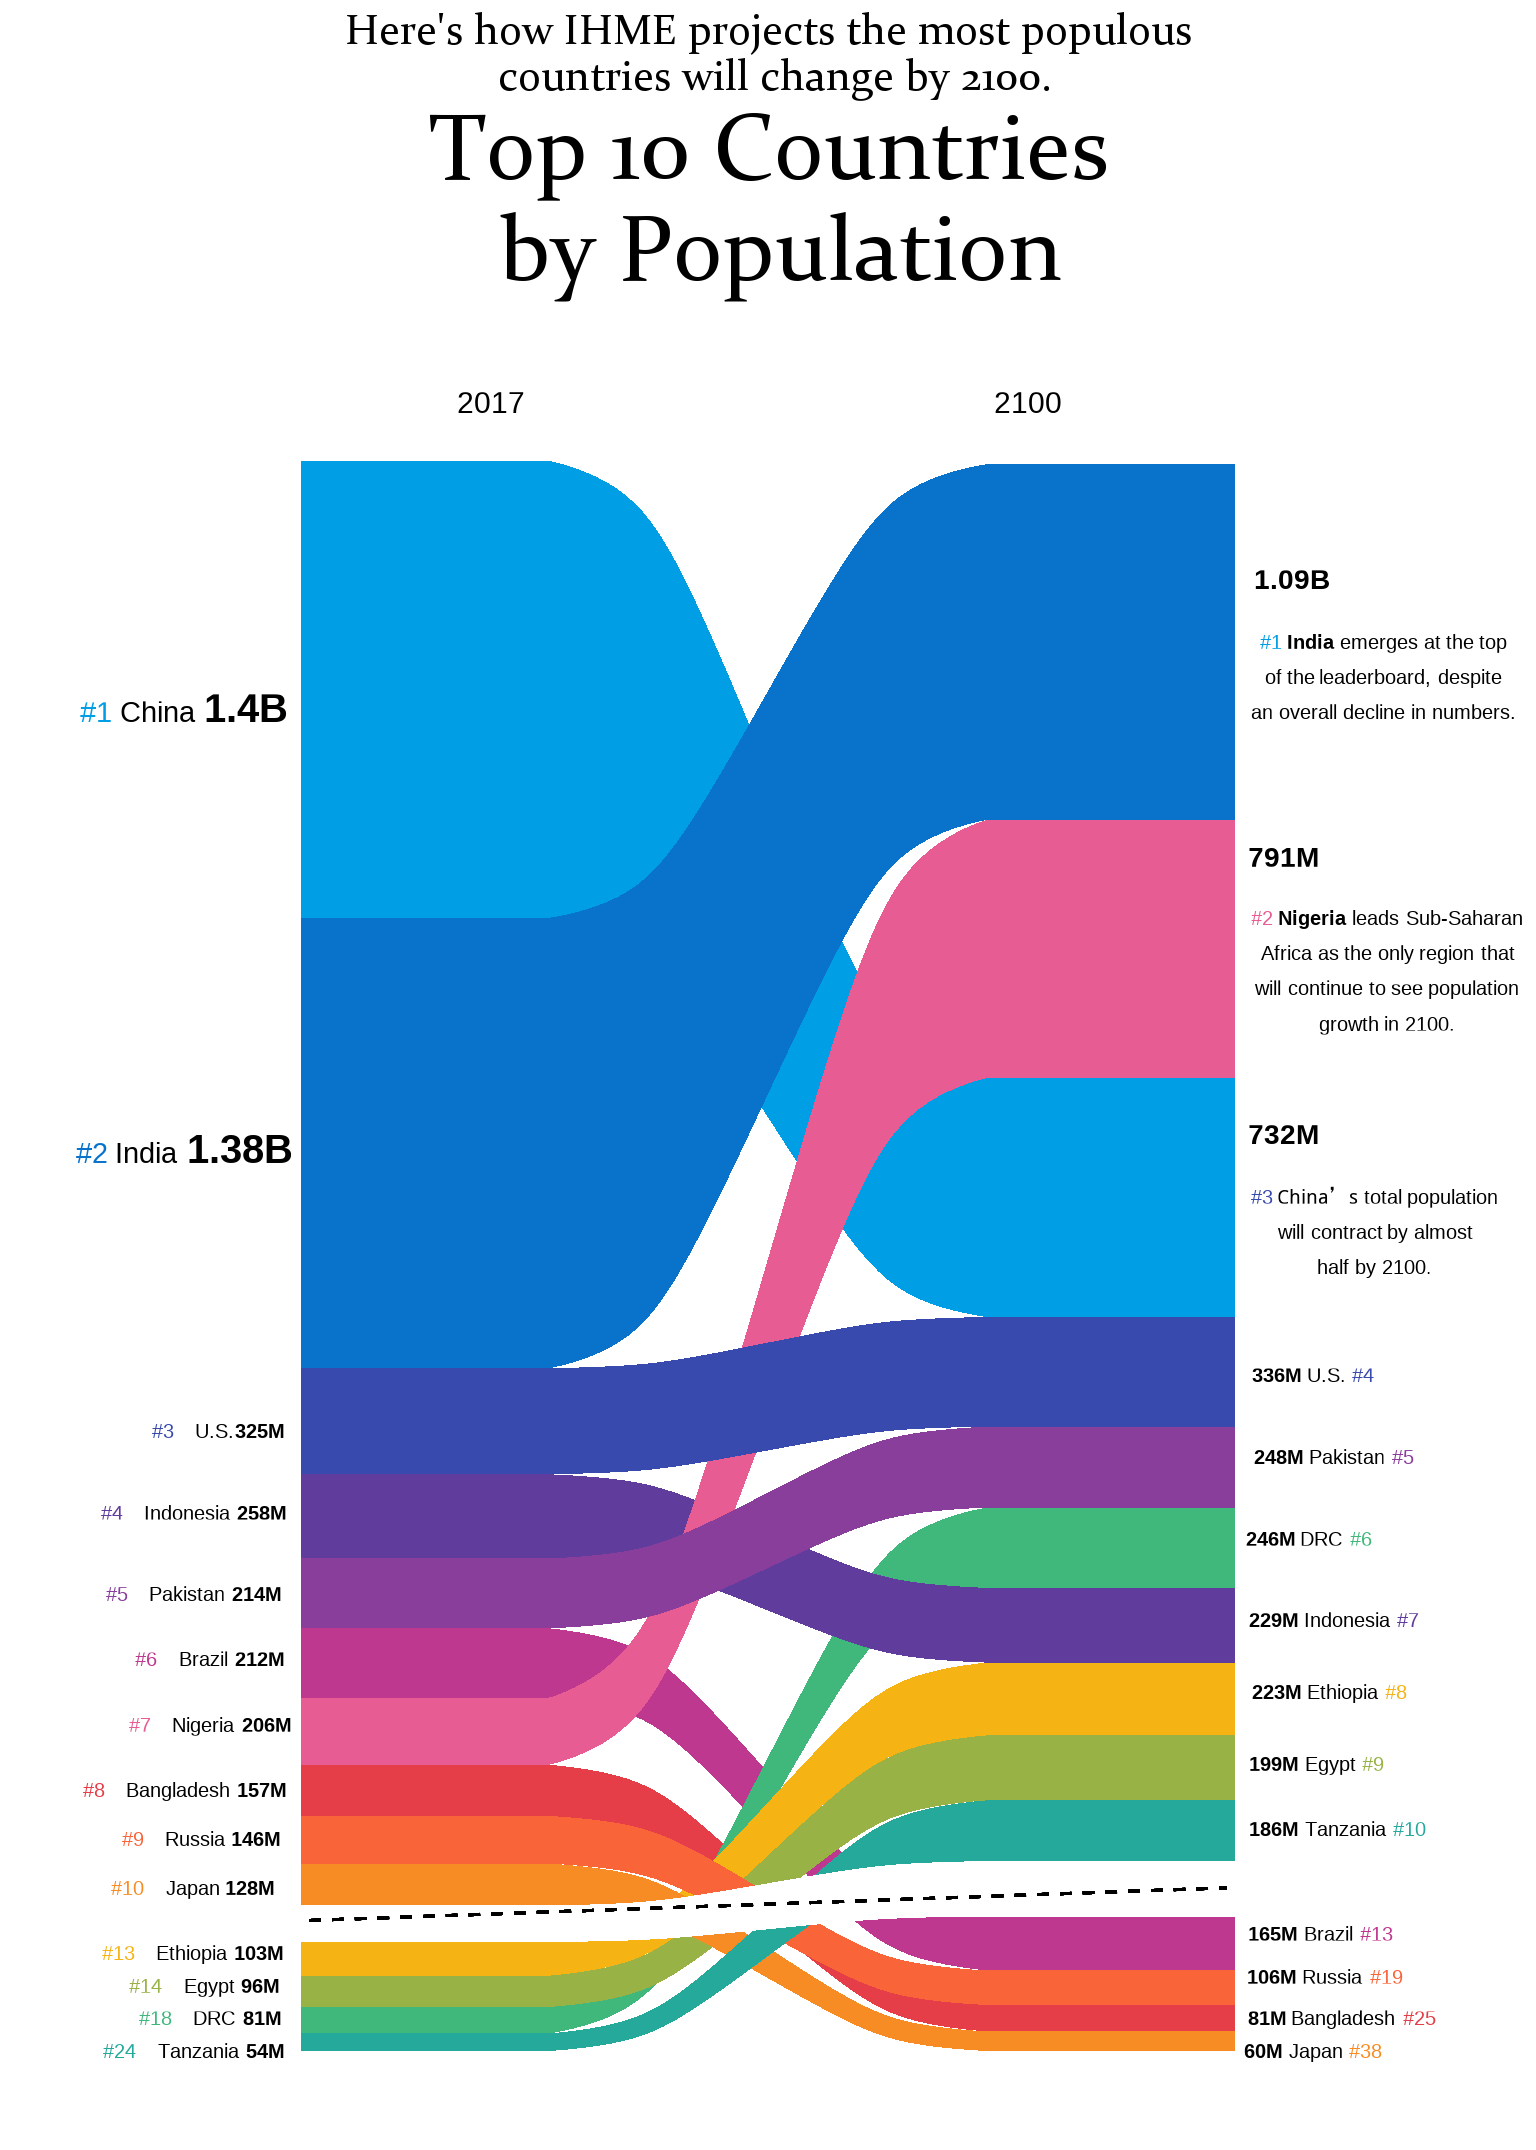
The Demography of the World Population from 1950 to 2100
Visualizing how global demography has changed and what we can expect for the 21st - century Our World in Data.
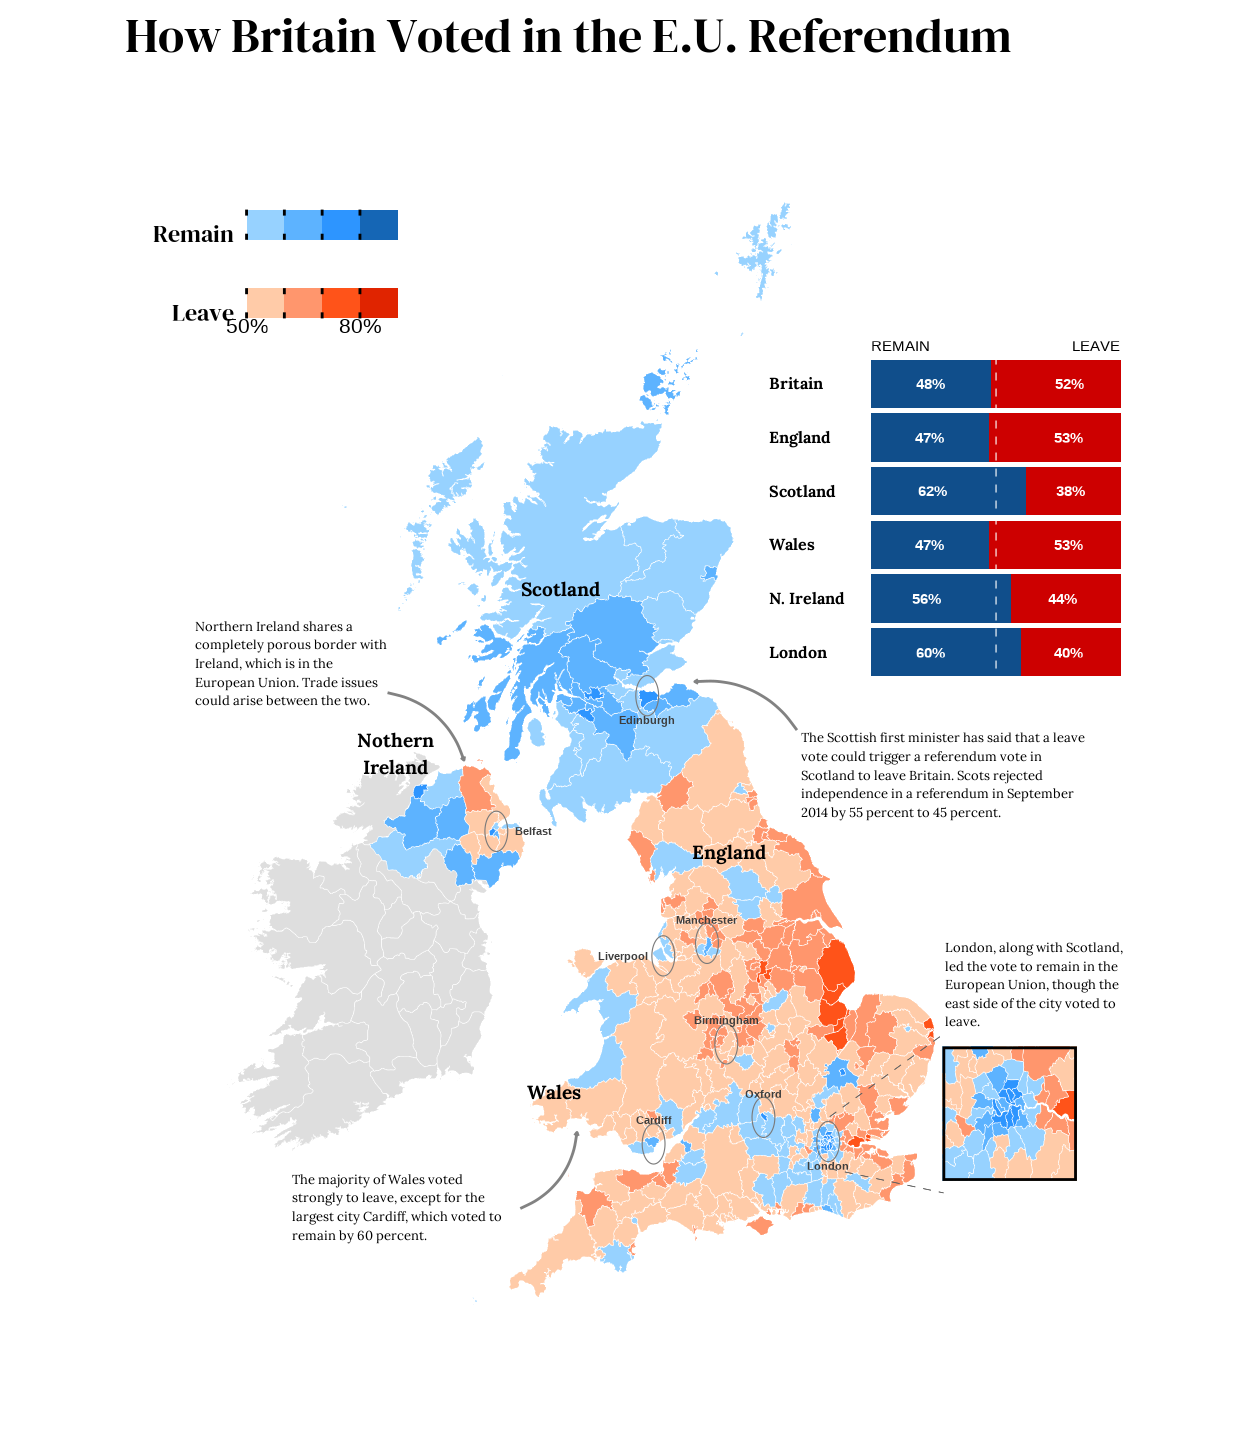
How Britain Voted in the E.U. Referendum
Britons voted on Thursday to leave the European Union. The Leave side led with 17.4 million votes, or 52 percent, versus the Remain side’s 16.1 million, or 48 percent, with a turnout of around 72 percent.
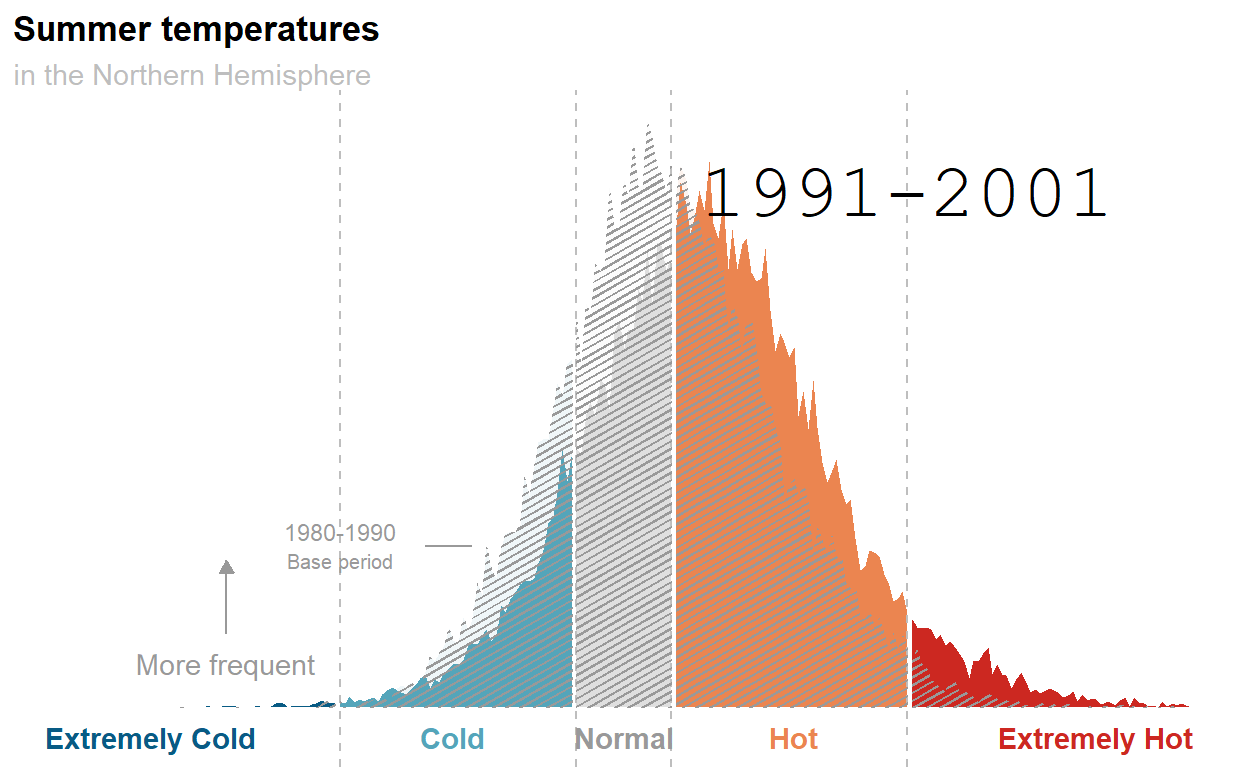
We Feel It Already. How About We Visualize It?
Summer temperatures are getting hotter and this plot does a pretty good job at showing that.
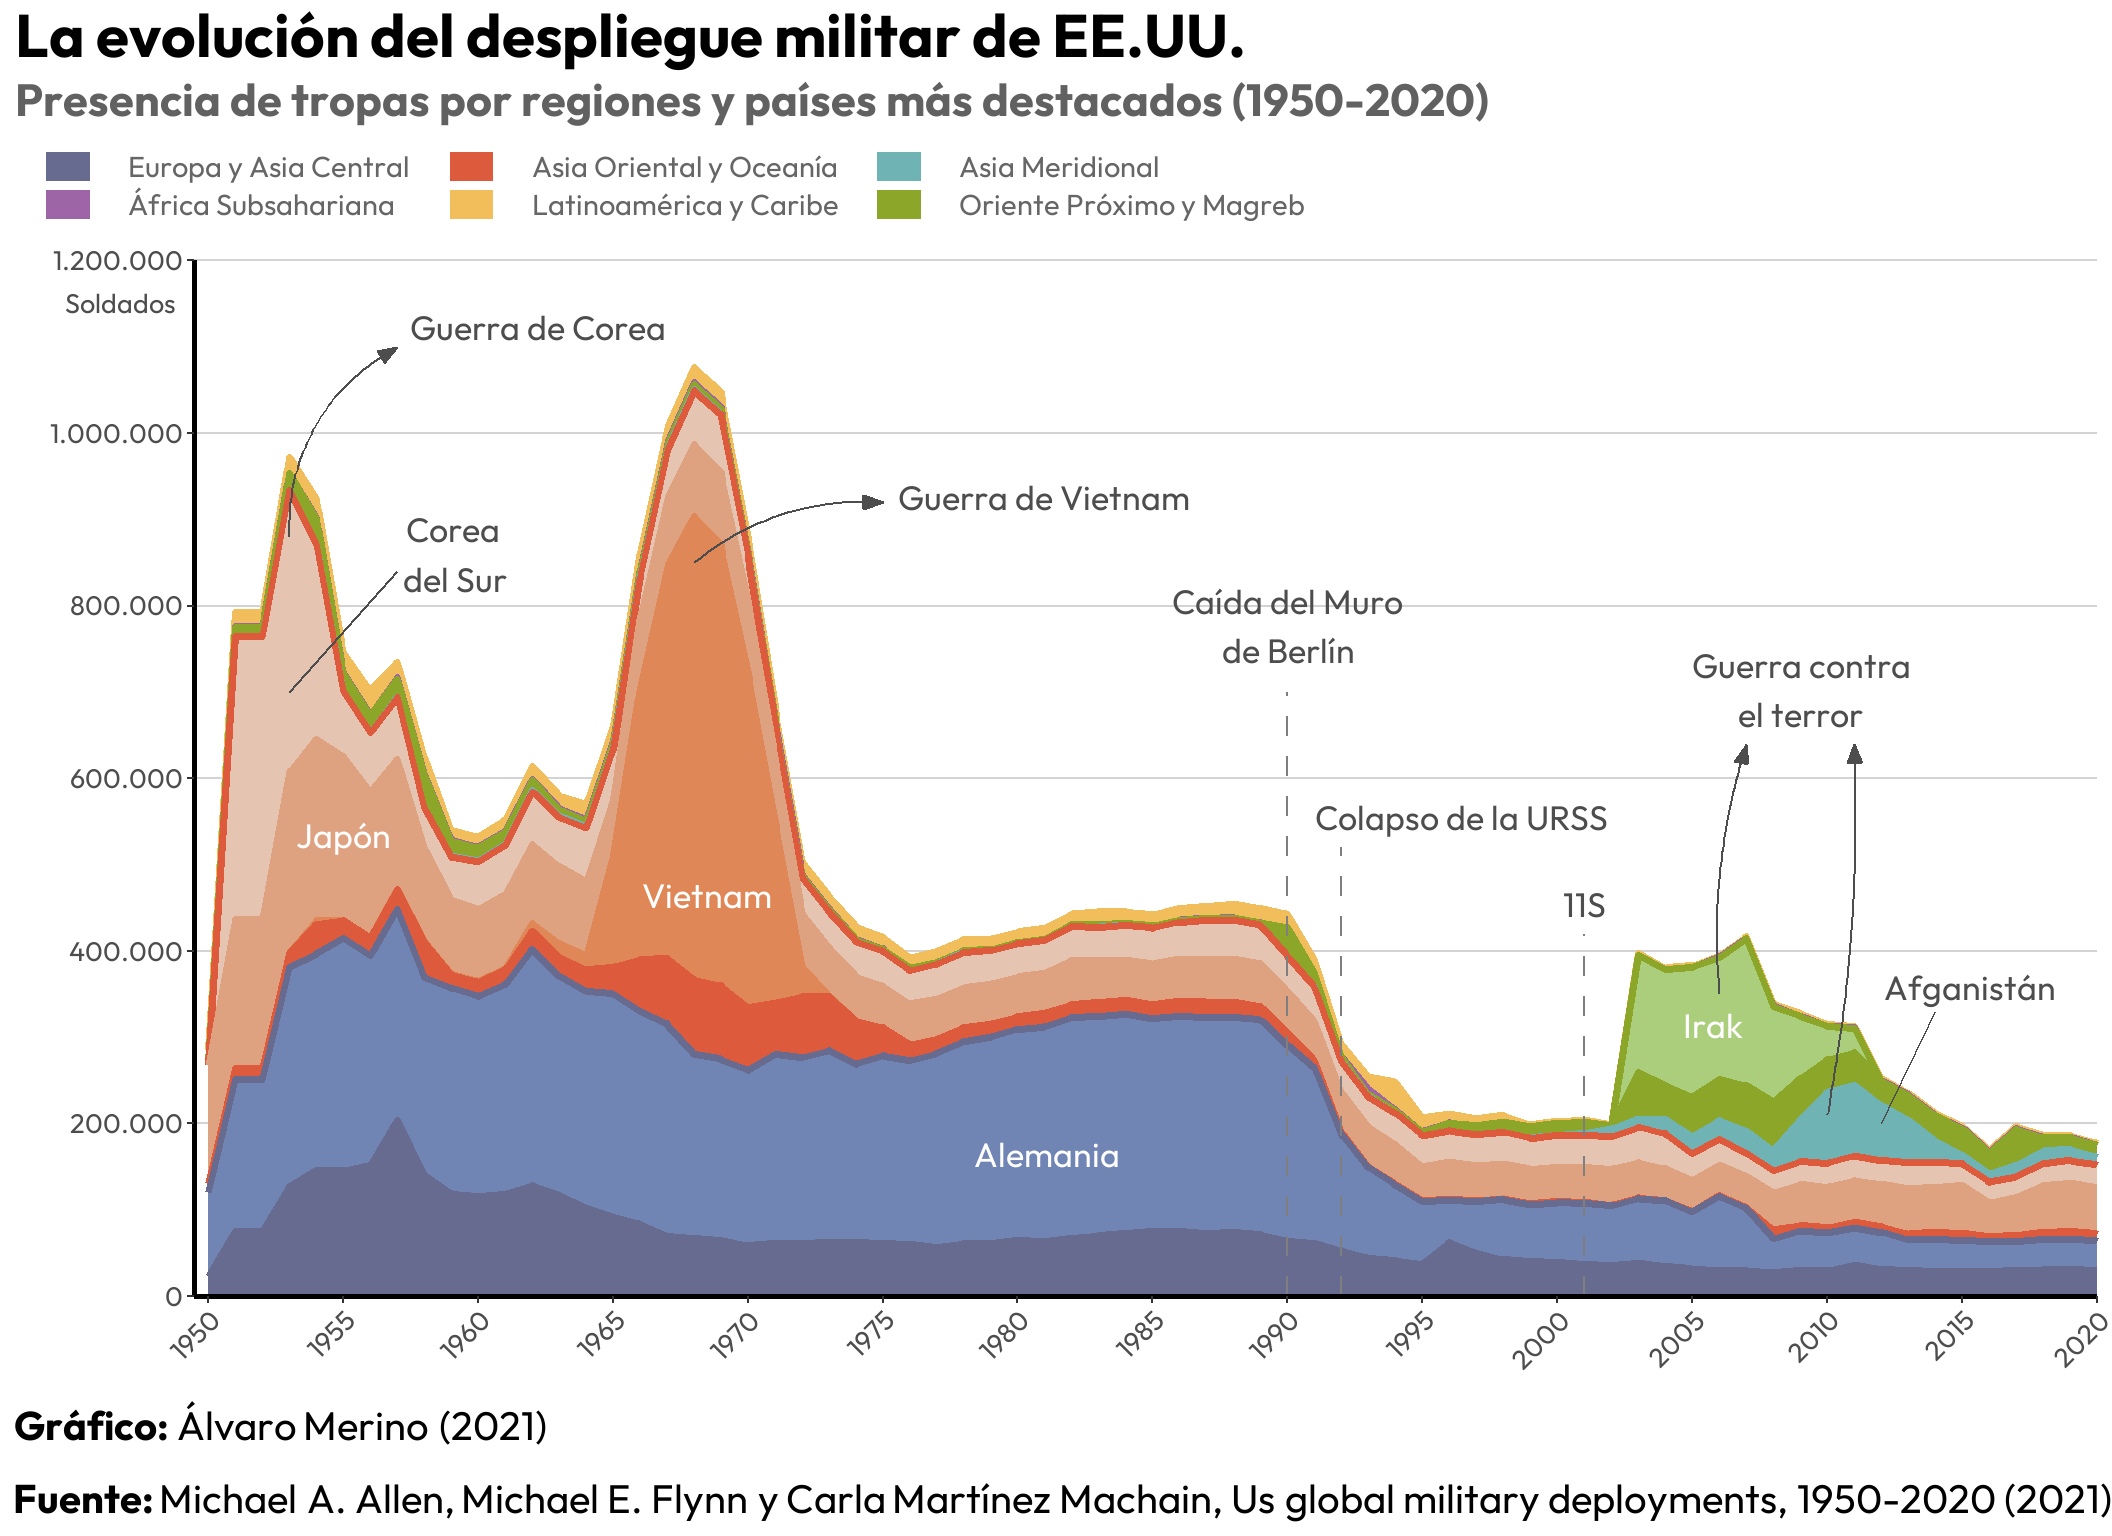
The Evolution of the US Military Deployment
Visualising data on the evolution of the US military presence around the world from 1950 to 2020.
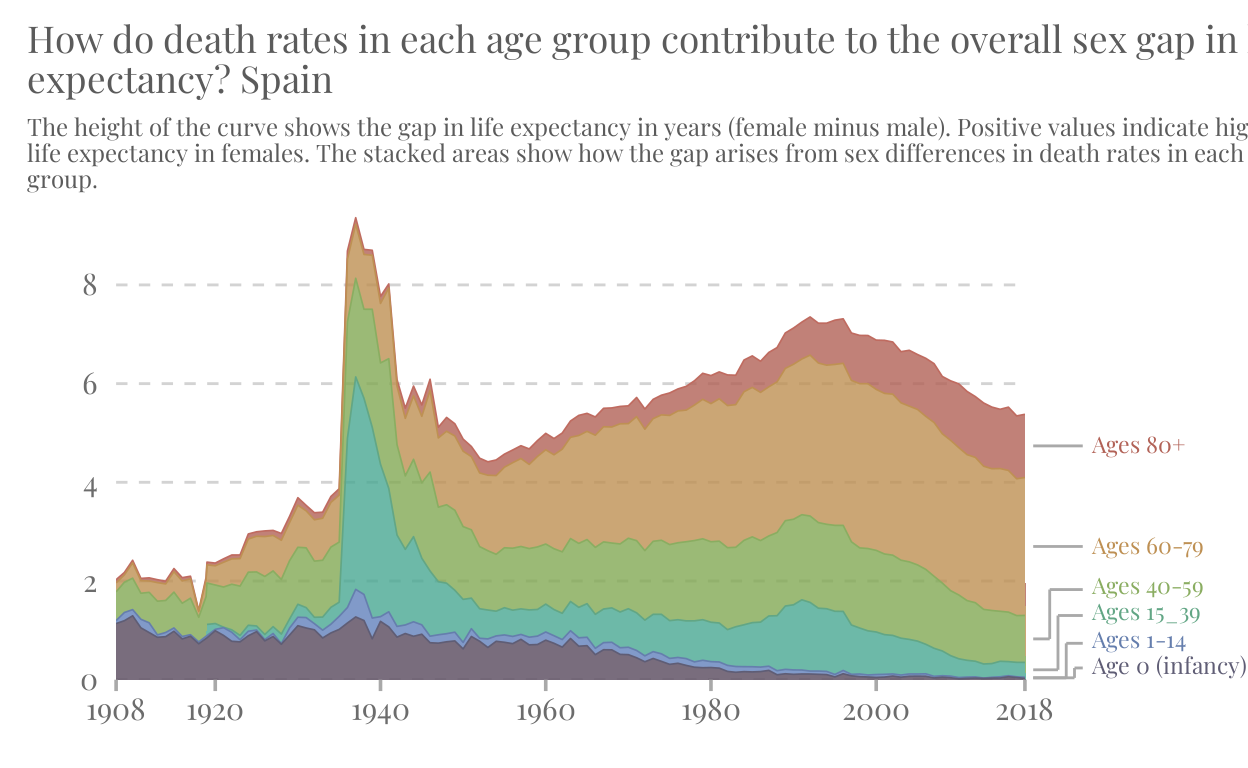
Sex Gap in Life Expectancy in Spain
How many more years do Spanish women live compared to men? This project replicates and enhaces a World in Data graph showing the evolution of the sex gap in life expectancy from 1908 to 2018 in Spain.
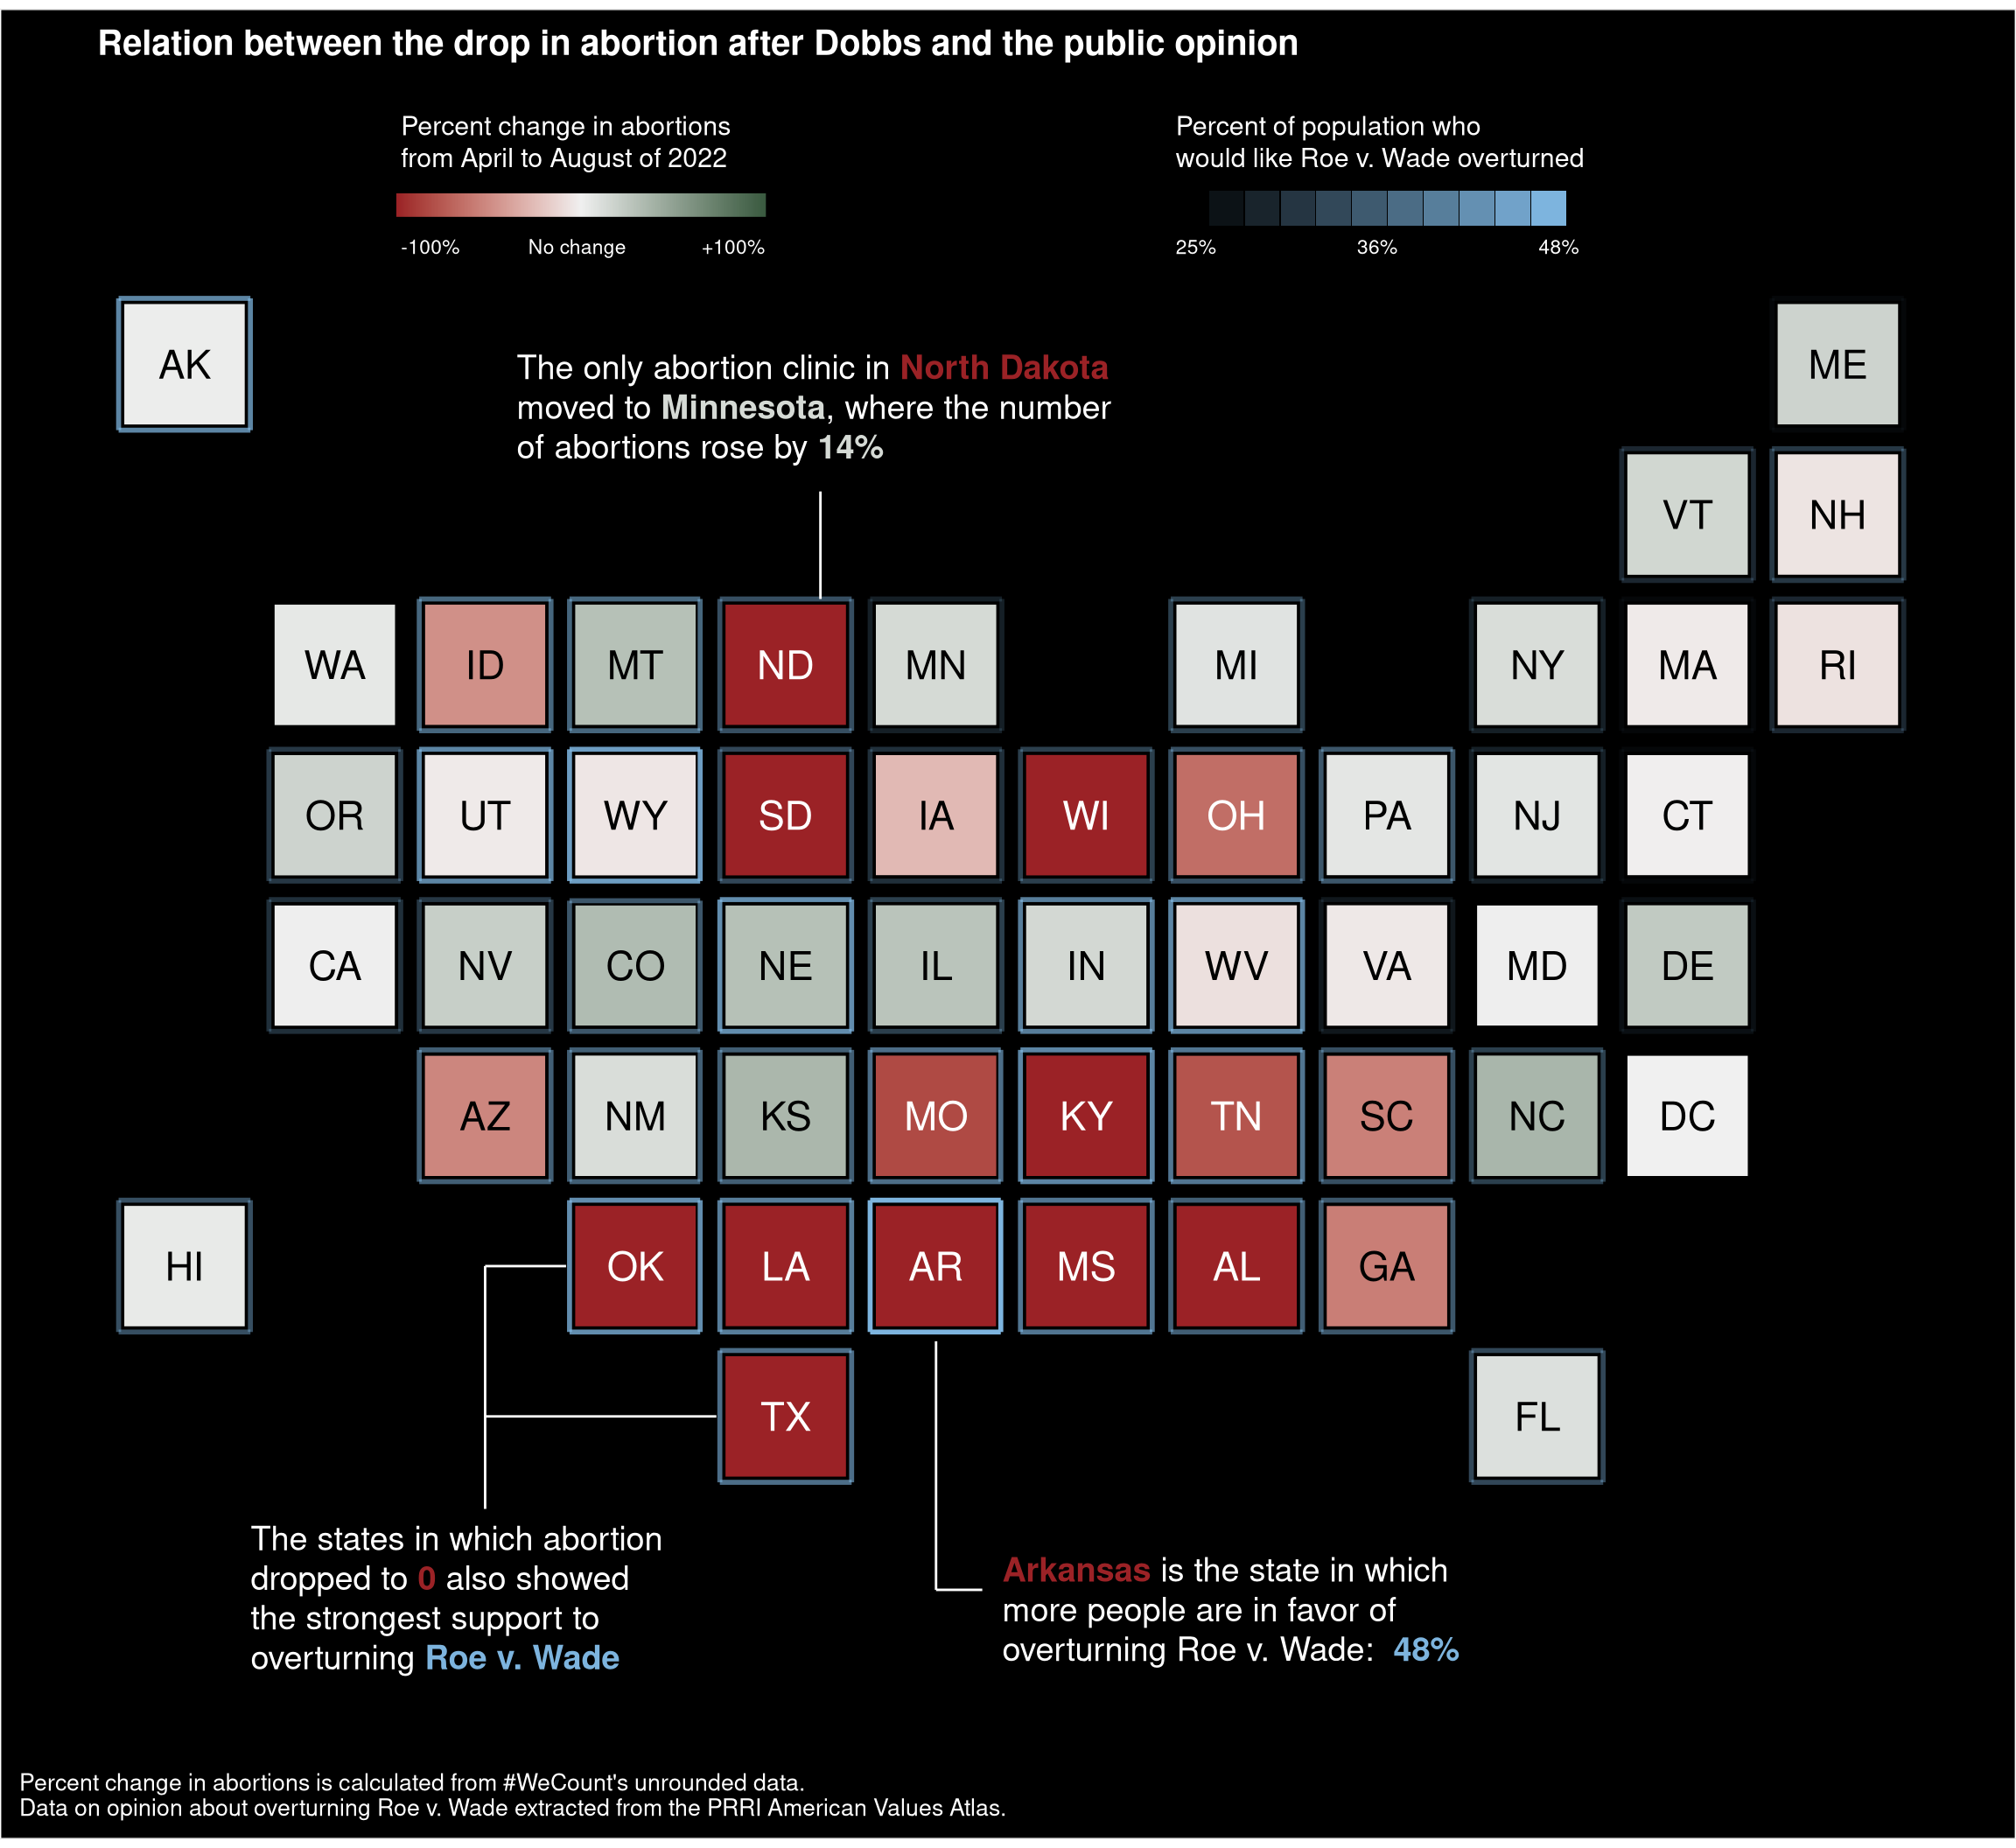
Change in Abortion after Dobbs
Visualization of the change in abortion data after the Dobbs decision, which gave power of legislation over abortion to the different states of the U.S.
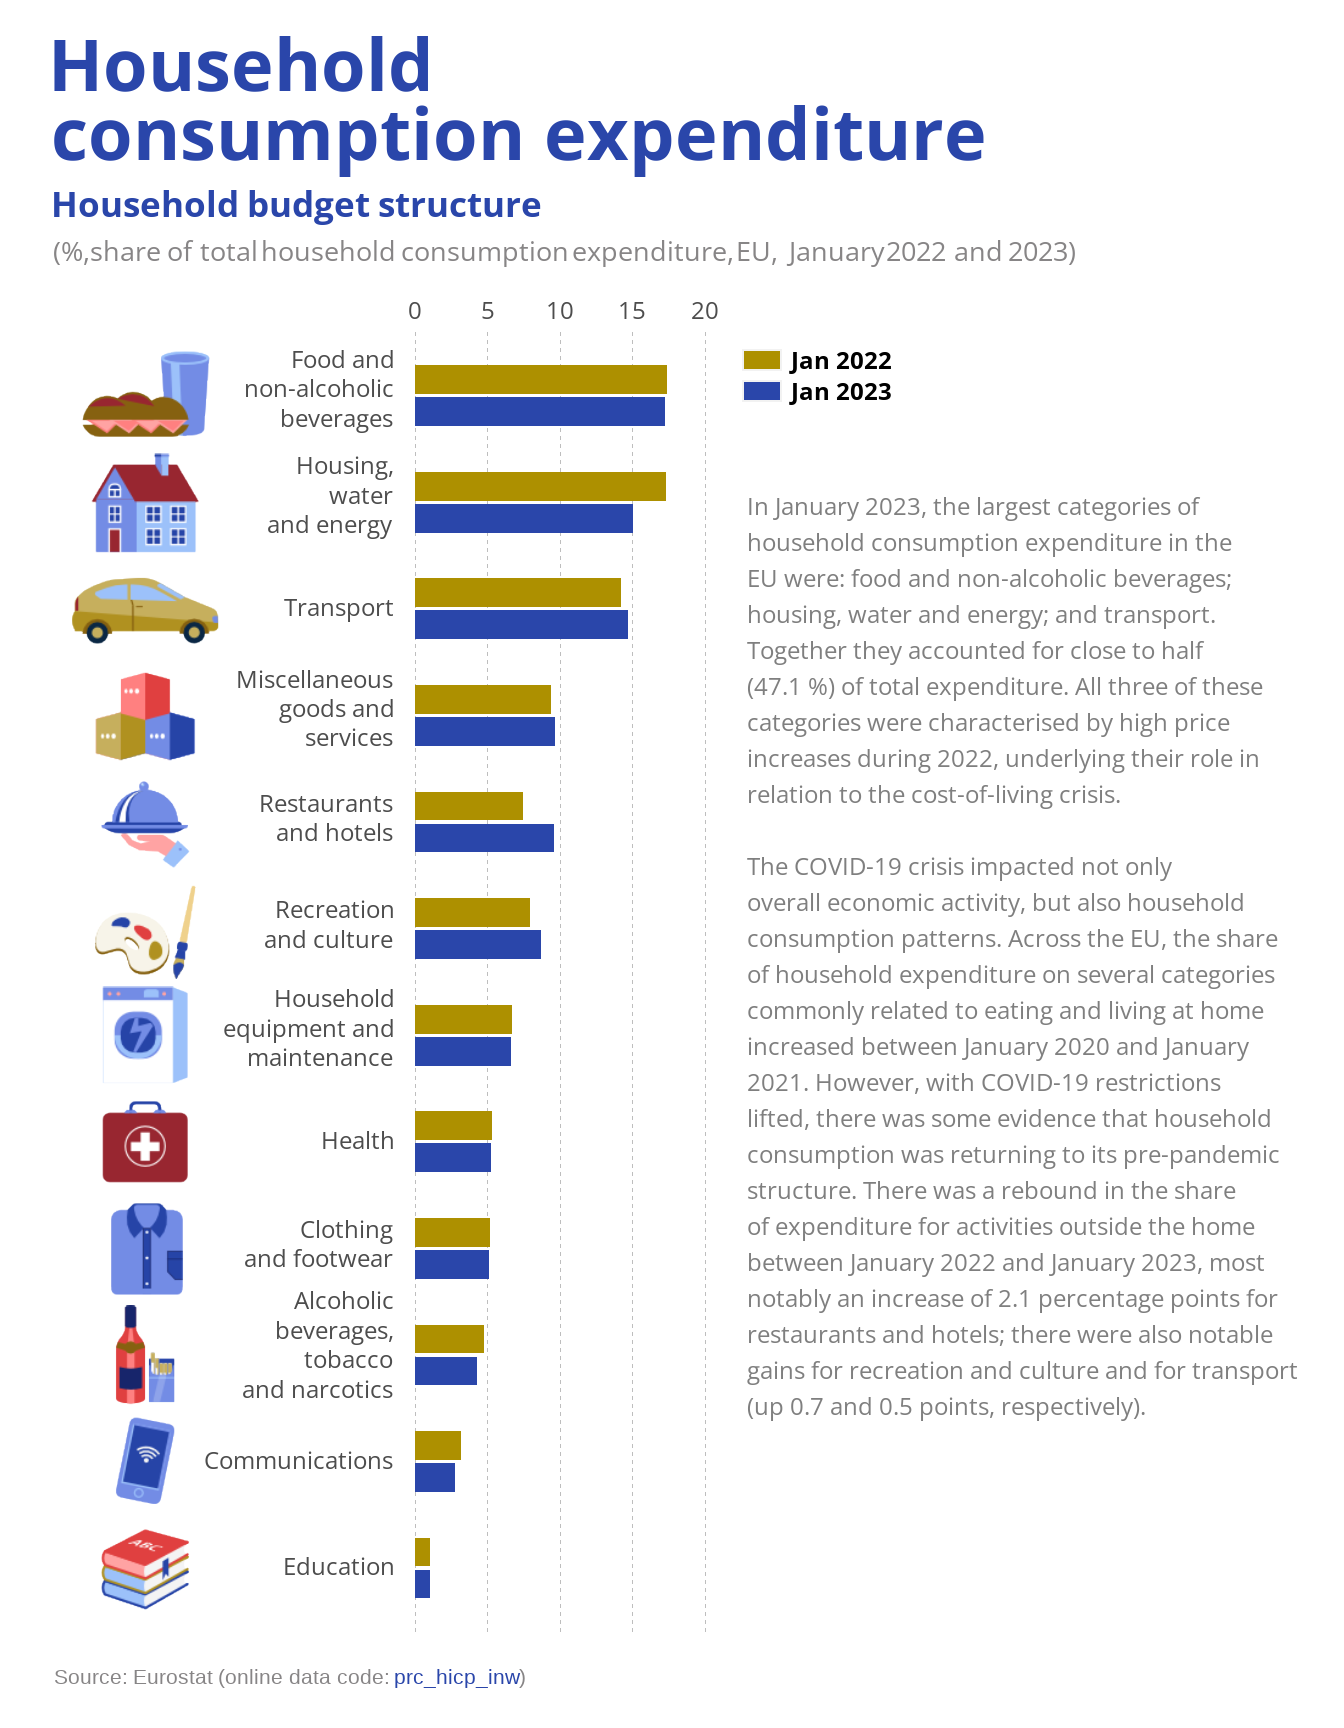
Post-COVID Wallet Woes: The High Cost of Living
COVID-19 had a major impact on the economy and effectively affected the consumption patterns of European households.
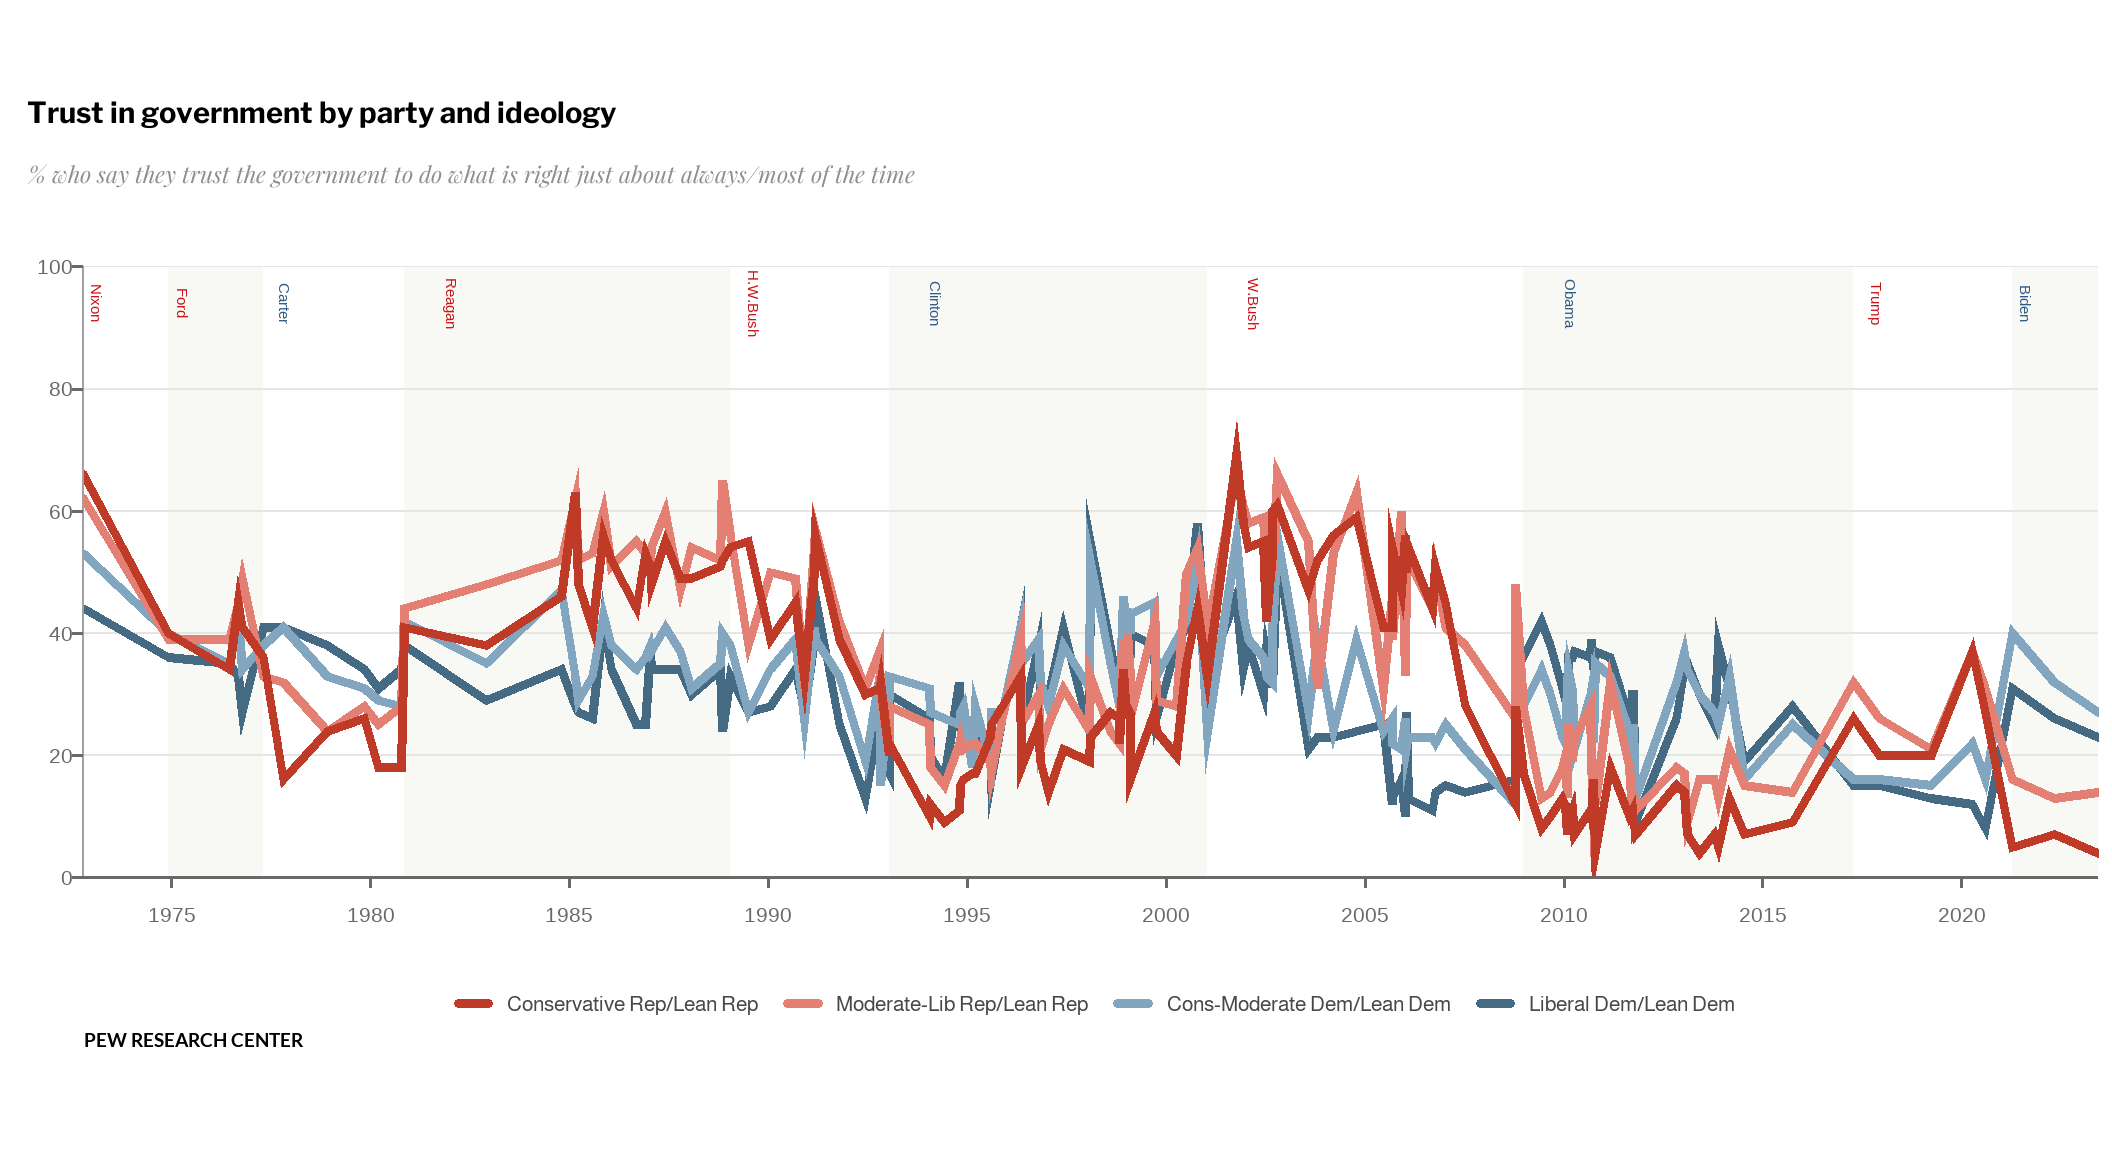
Public Trust in Government Hits Historic Lows
Using Pew Research data to visualize the evolution of public trust towards different U.S. governments between 1972 and 2023.
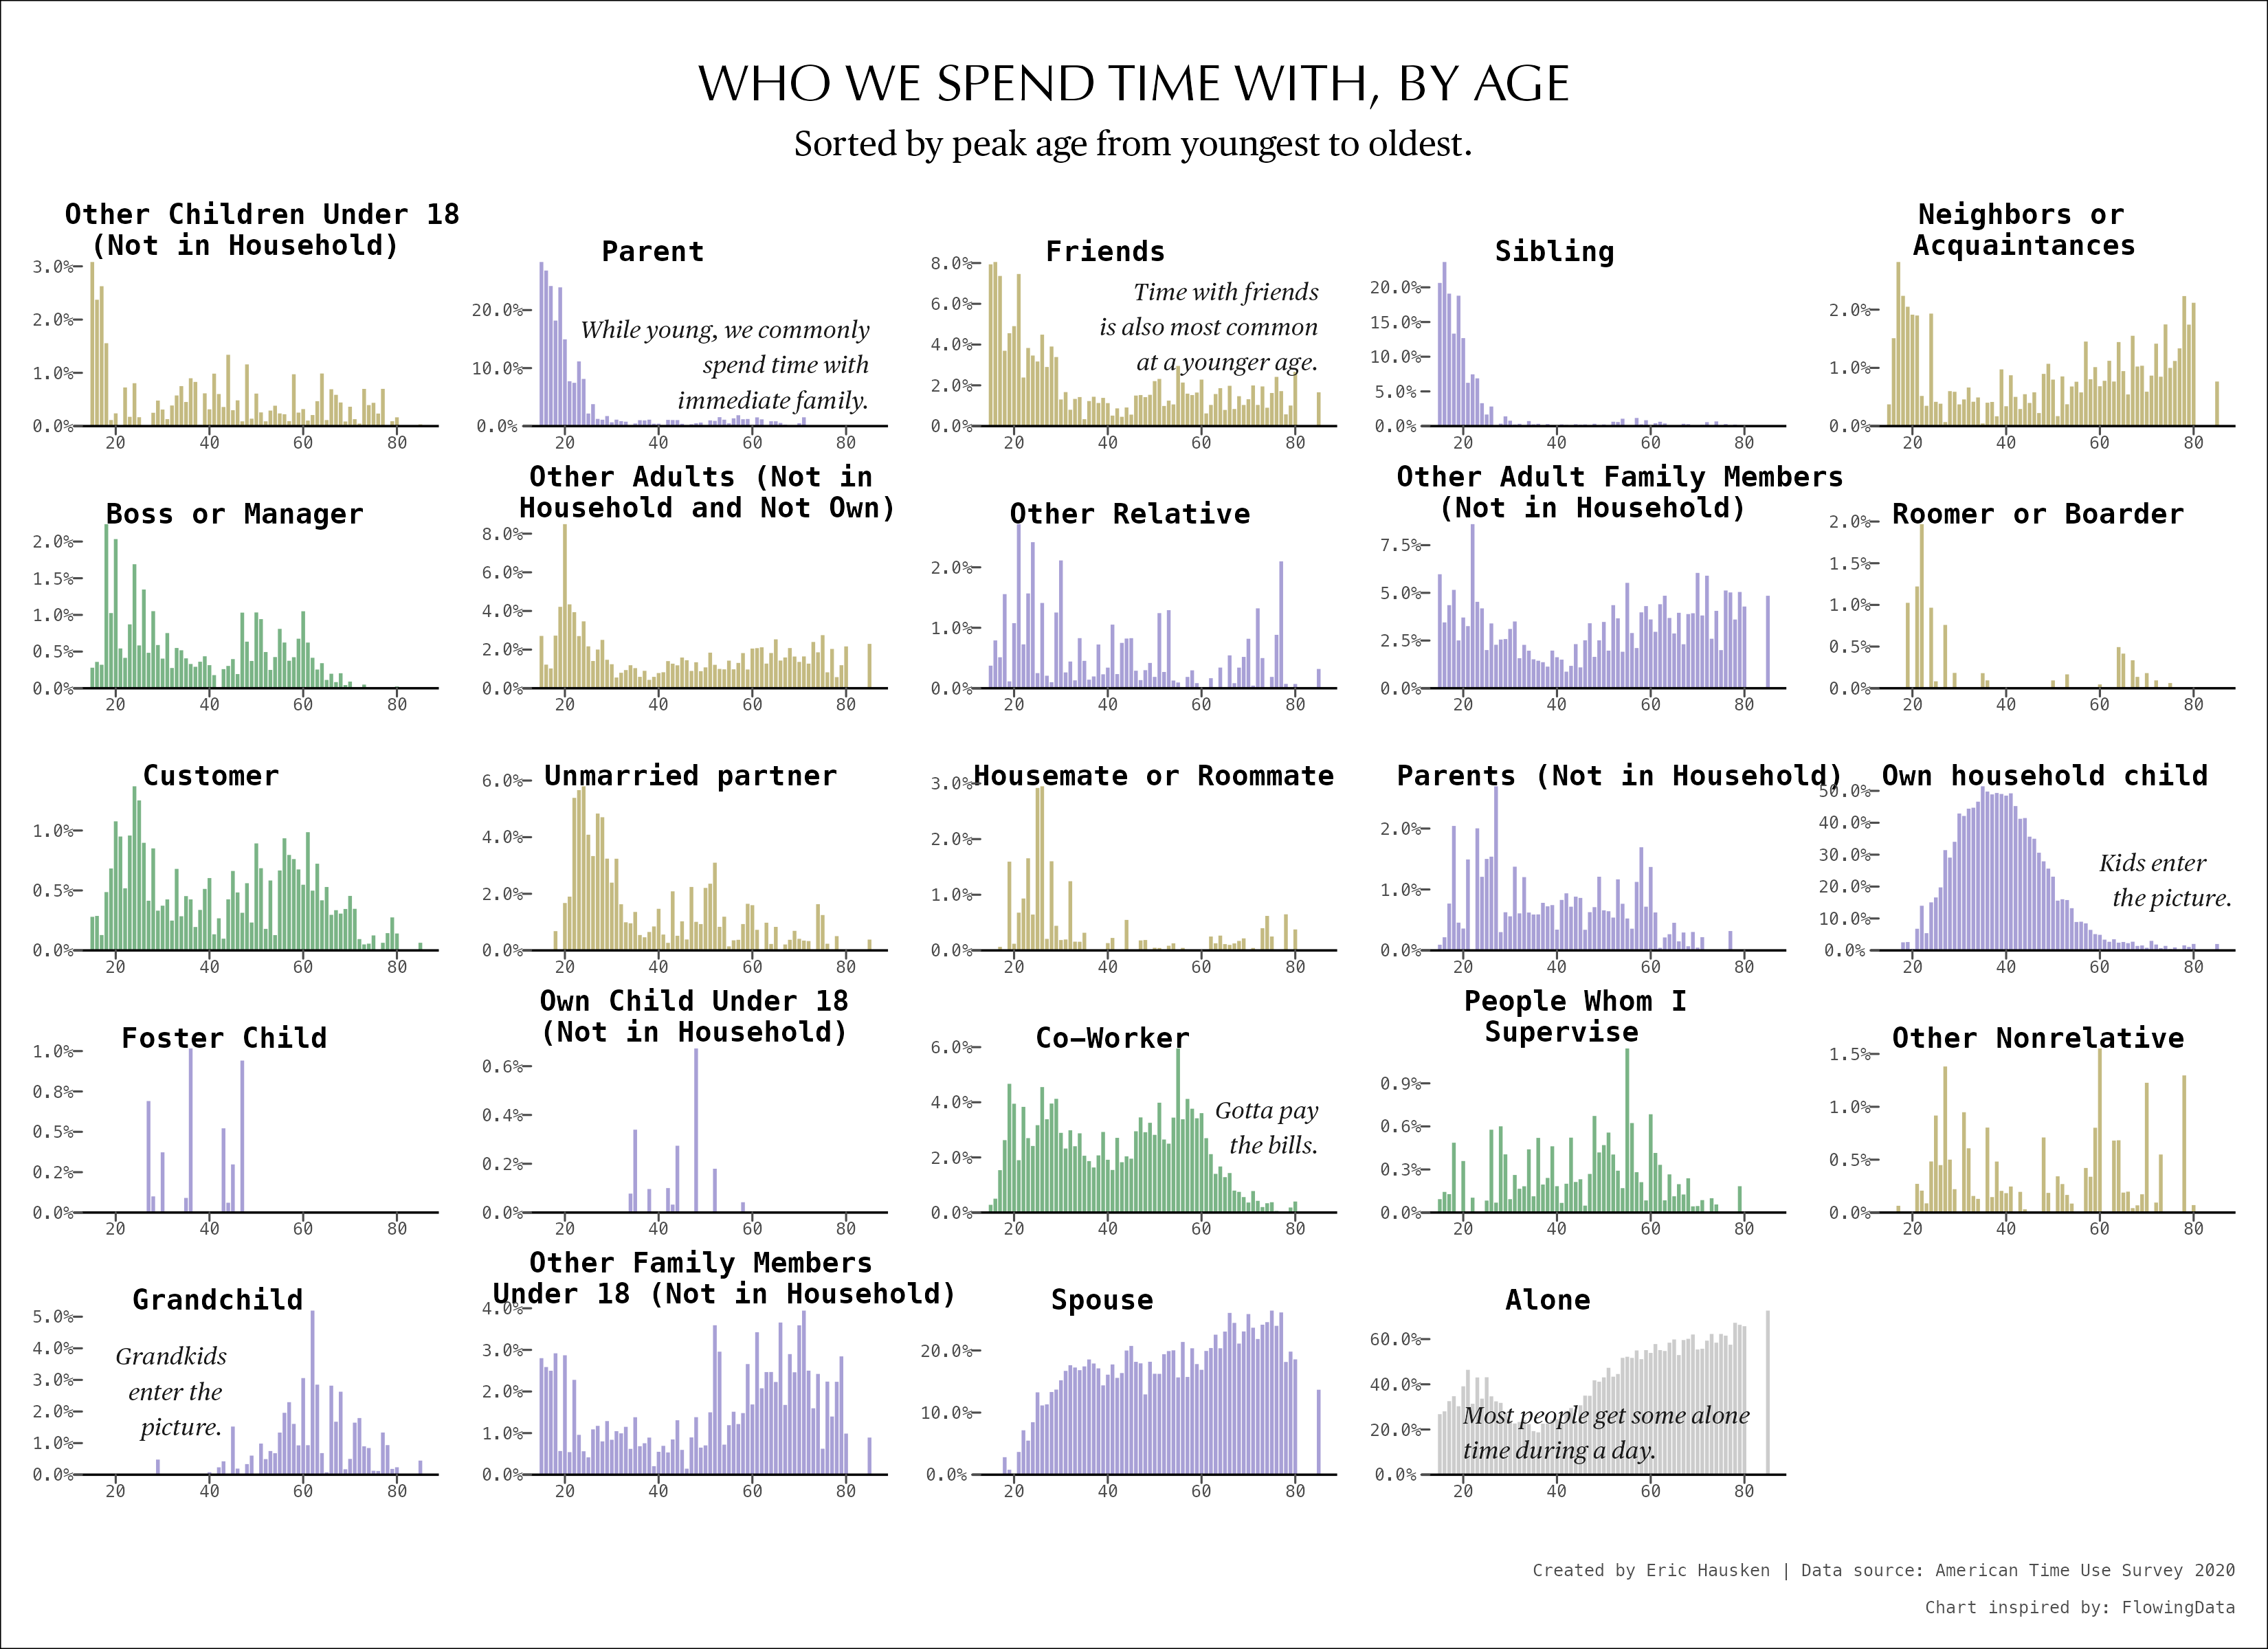
With Whom Did We Spend Our Time in 2020?
This article goes through the steps of recreating a bar chart with small multiples using the ggplot2 package in R. The original chart shows the distributions, by age, with whom we spend our time. The replication and enhanced versions include new data from the year 2020.
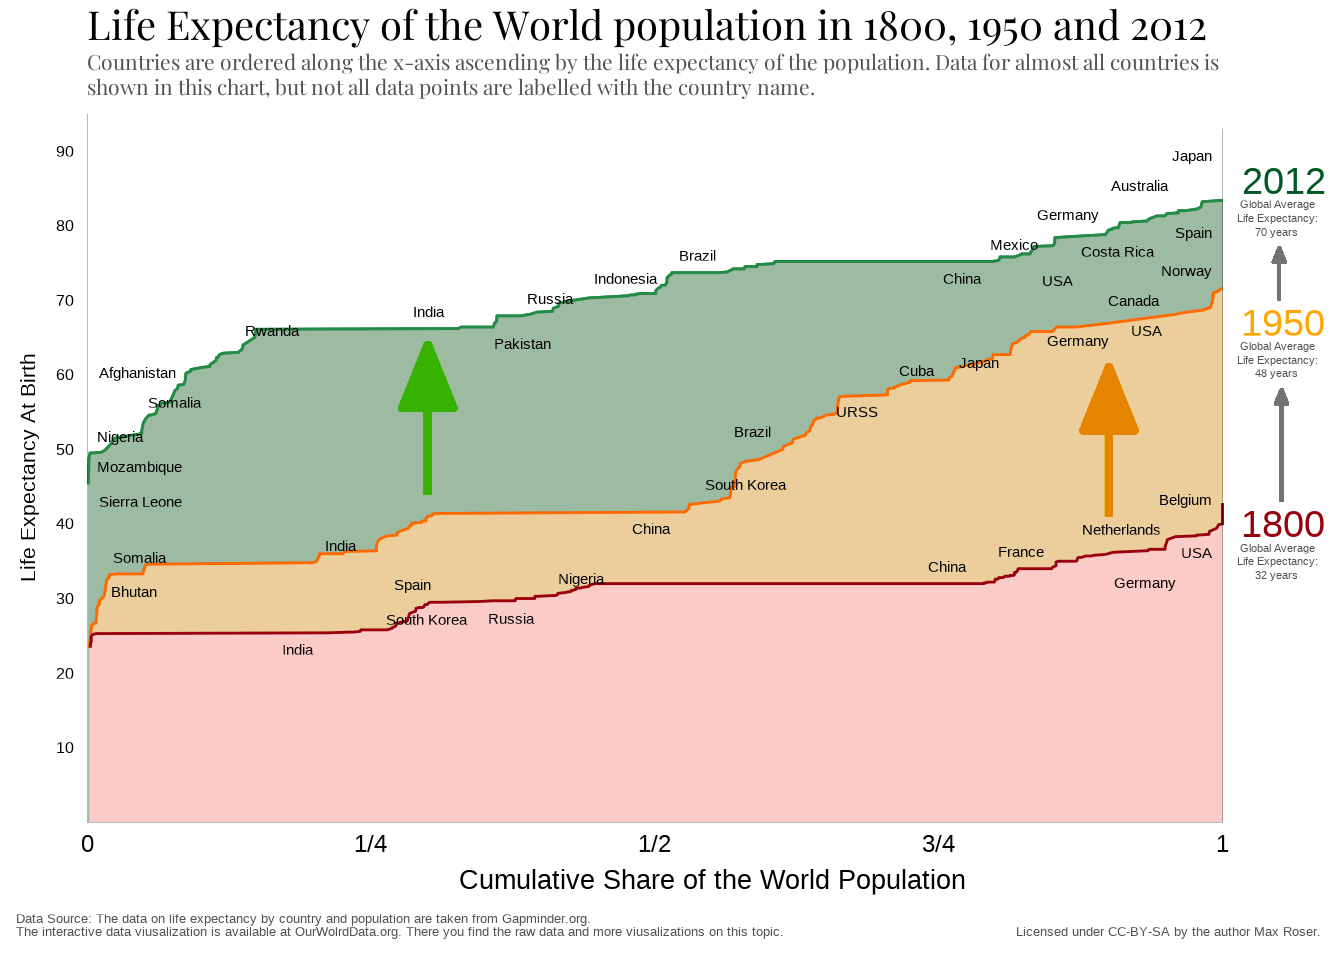
Life Expectancy Increased in All Countries of the World
The aim of this project is to reproduce, layer by layer, a chart on Life Expectancy evolution from Our World in Data.
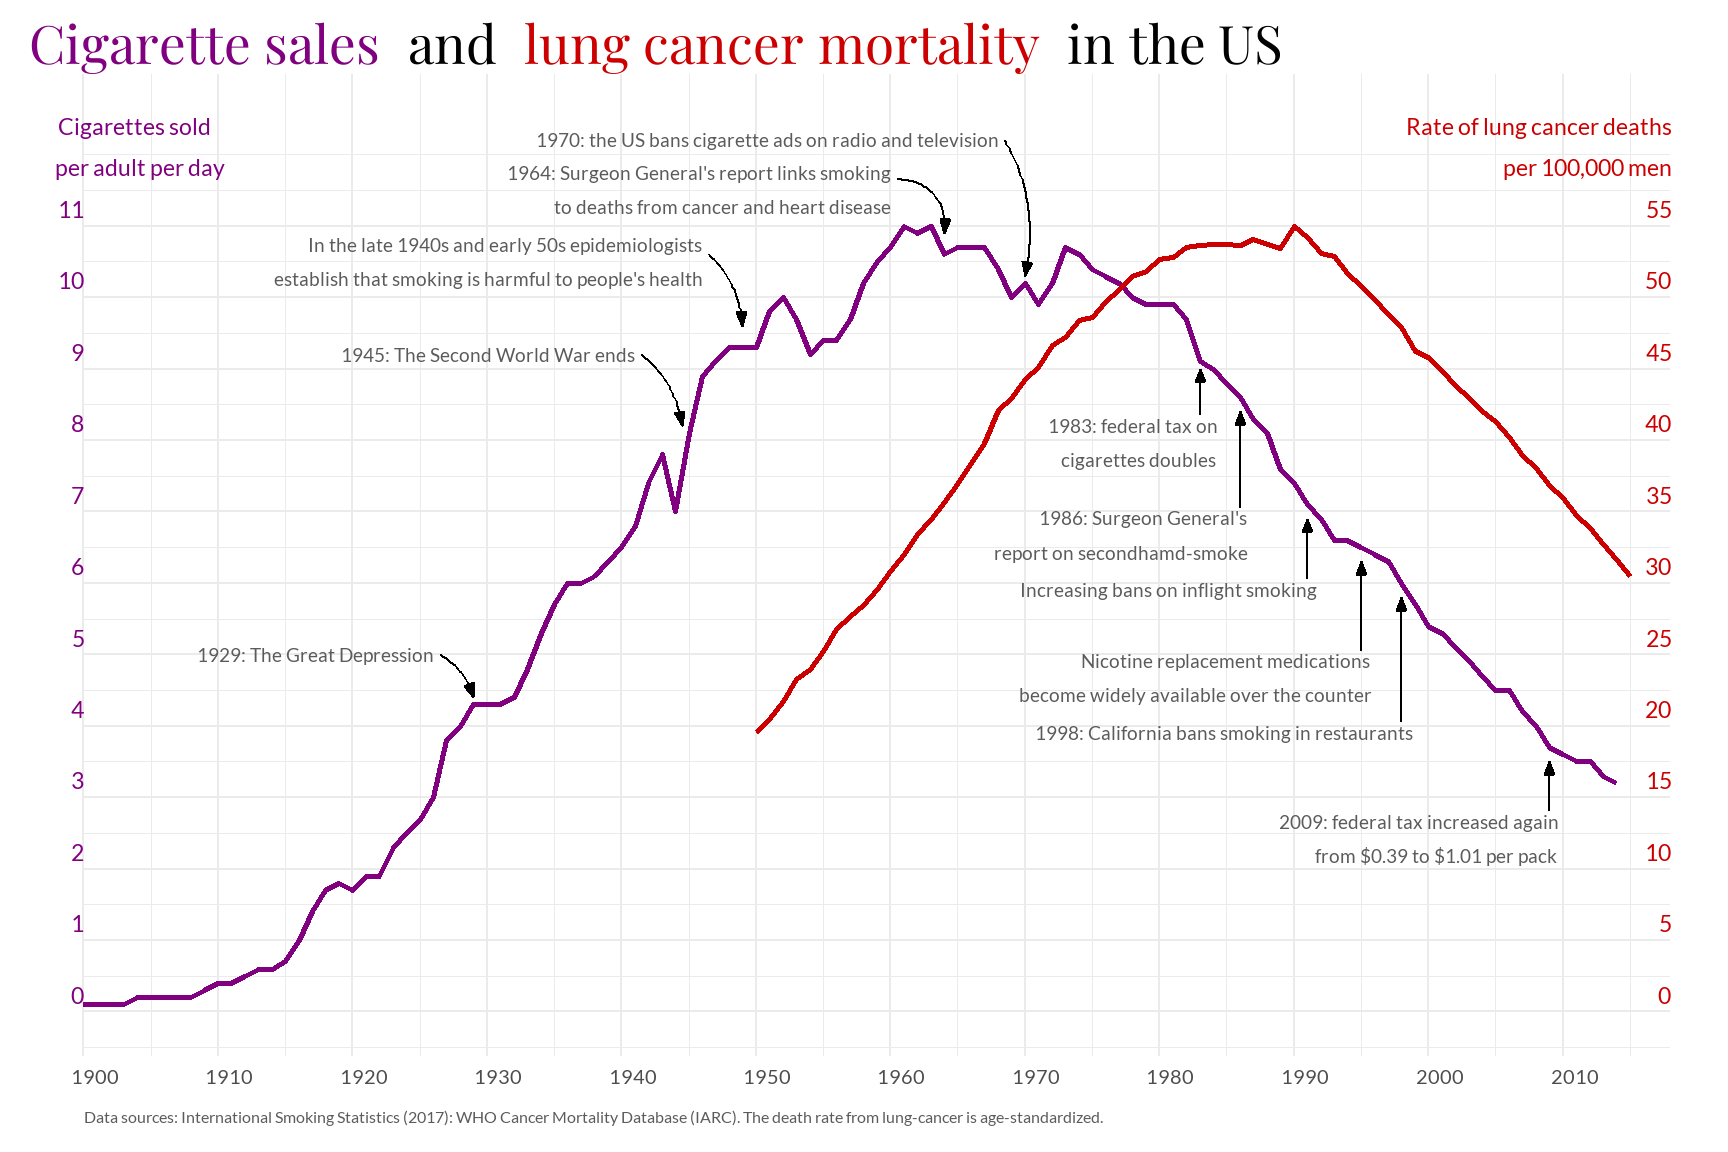
Cigarettes Sales and Lung Cancer Mortality in the US
Every year, around 8 million people die prematurely as a result of smoking. In this case, examining the relationship across the cigarettes sales in men in the United States.
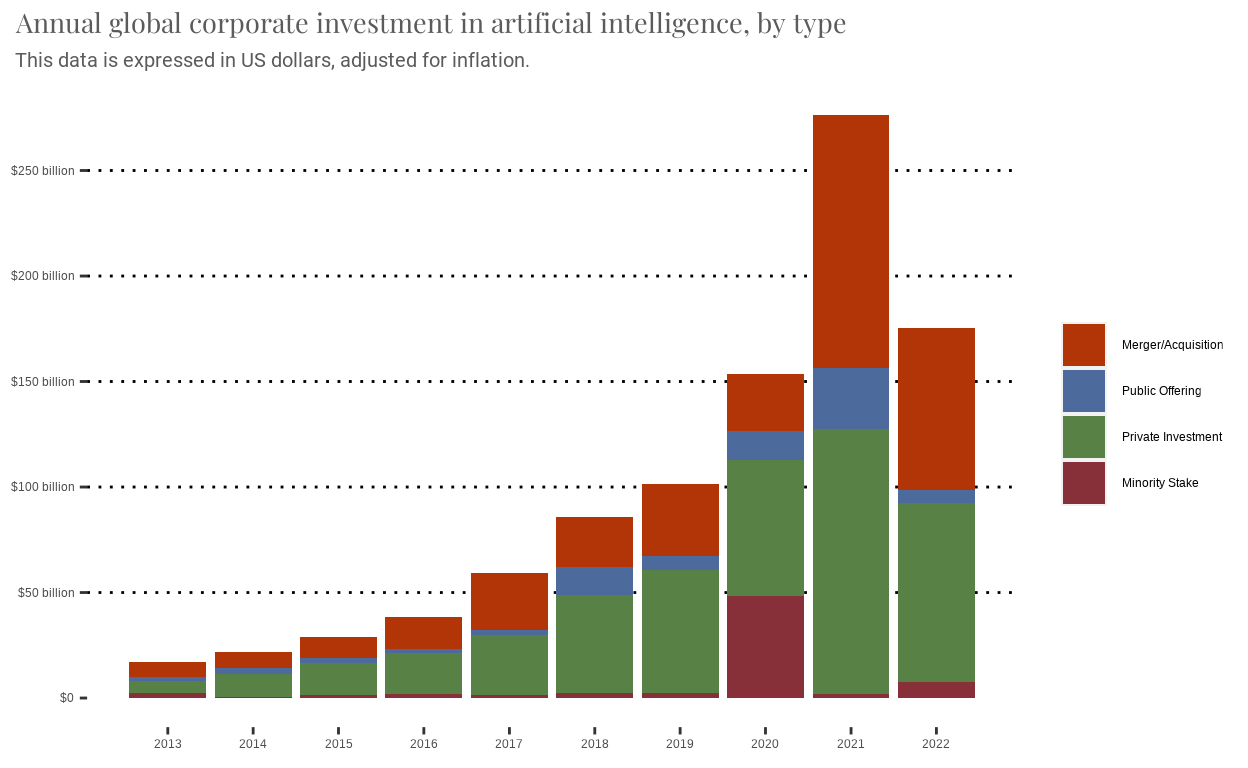
Annual Global Corporate Investment in AI by Type
This project replicates a graph from Our World in Data and proposes an improvement.
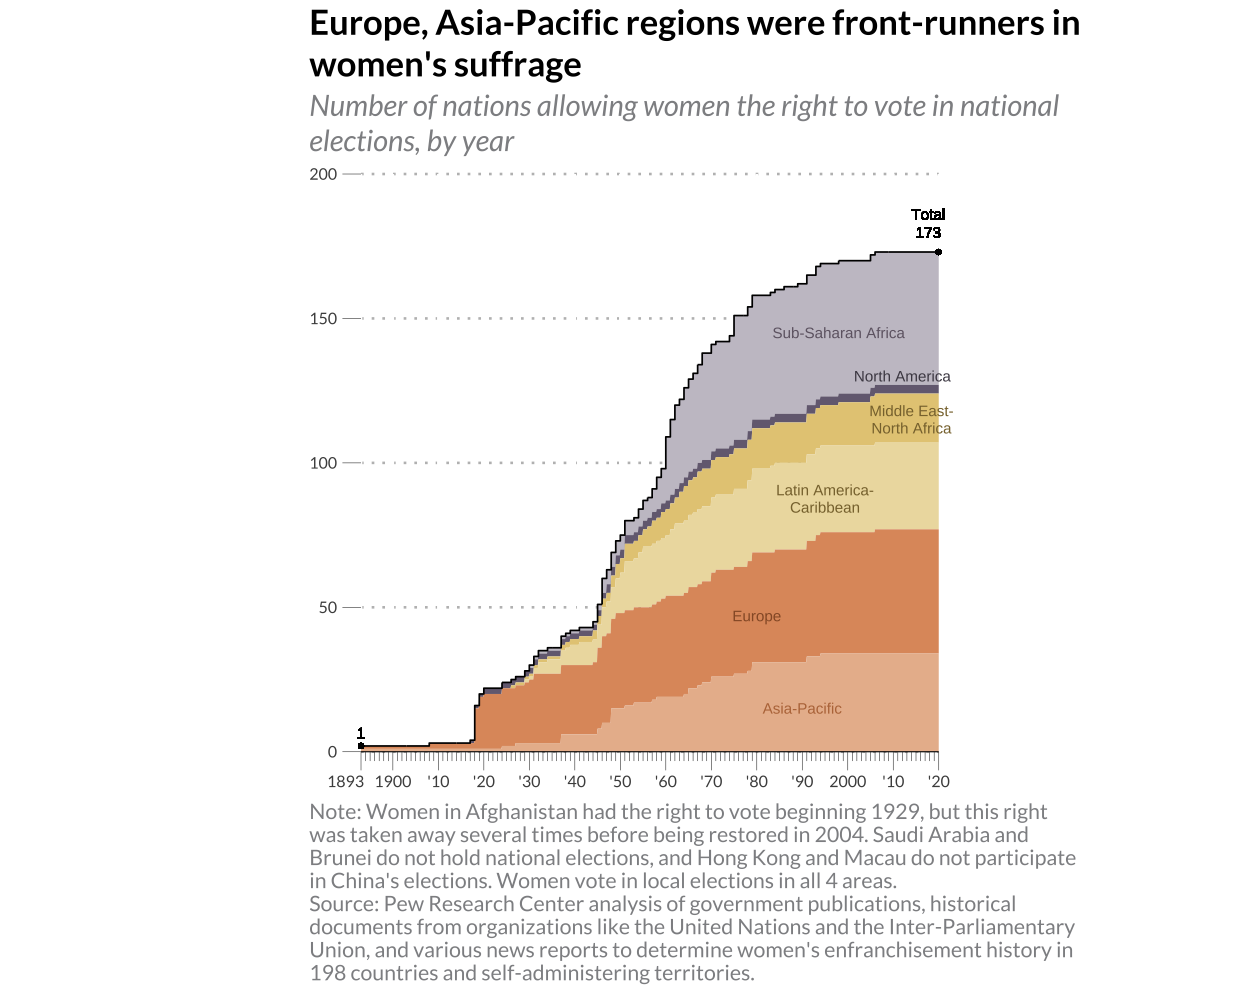
Women's Suffrage Across Time
The recreation of a graph illustrating the development of the women's suffrage movement throughout the years.This graph is replicated and then improved by adding data describing the development of women's political participation.